New job reports were just released! Here’s our labor market insights for February 2024.
Key Takeaways:
February—in addition to being Black History Month, there are some other special days to celebrate: Groundhog Day, Superbowl, Valentines Day, National Drink Wine & National Margarita Day (seriously, it’s a thing). And of course, it’s the first month we can do a look back on the previous year’s labor data in its entirety (December data isn’t released until the end of January).
Every January I conduct an informal survey. I ask everyone in my personal and professional network a simple question: “Would you say the labor market was good or bad last year?” I ask friends, business contacts, random people at parties (much to my wife’s chagrin), etc. It’s not scientific (I can see my statistics professor rolling his eyes), but every year I ask hundreds of people the same question, and every year there is a consistent impression—the majority of people either agree it was “good” or “bad.” Not this year. Maybe it’s because it’s an election year and no one can seem to agree on anything, but this year it was an even split.
So, is it possible to put a label on 2023? Most reasonable people will say no, we can’t label something so fluid with no concrete end point. Me, I say “hold my beer—or wine/margarita (after all, it’s national wine and margarita month!)—let’s give it a try!” While there are a multitude of data points, I typically use the “big four” as key markers: (1) job openings, (2) quit rate, (3) layoff rate, and (4) hire rate. Now that we have 12 months of information, let’s take a look at what the data says:
Job Openings:
2023 was the third-best year on record when it comes to the average job openings rate, and we ended the year with just over 9 million open jobs.
Quit Rate:
2023 was the third-best year on record when it comes to the average quit rate. The quit rate had peaked around 3% of total employment in late 2021 into early 2022, during what briefly was known as the Great Resignation as workers left their old jobs in search of positions that paid more and offered better working conditions; it since has declined to 2.3%. Quits, which are seen as a measure of worker confidence in the ability to change jobs and find another one, continue to remain very low.
Layoff Rate:
2023 was the third-best year on record when it comes to the average layoff rate—just 1.0%. While layoffs grabbed headlines in 2023, it was a historically stable year across the board, except for the tech sector.
Hire Rate:
2023 was just about average, ranking 11th out of the 23 years on record. Given there were so many new jobs created, the hire rate was my biggest surprise of the year.
So, was 2023 good or bad? At a micro look, if we compare 2023 to 2022, most would consider it a “bad” year (2022 was off the charts). However, at a macro look, it was surprisingly a very good year (considering we were waiting for a recession to hit). With the benefit of hindsight, we can now say that the job/labor market in 2023 was actually stronger than anticipated. While there’s no right or wrong answer, one thing is for certain—this time next year will feel very different, and no one has a clue what’s in store for us. Buckle up, 2024 will be a fun ride!
By the Numbers:
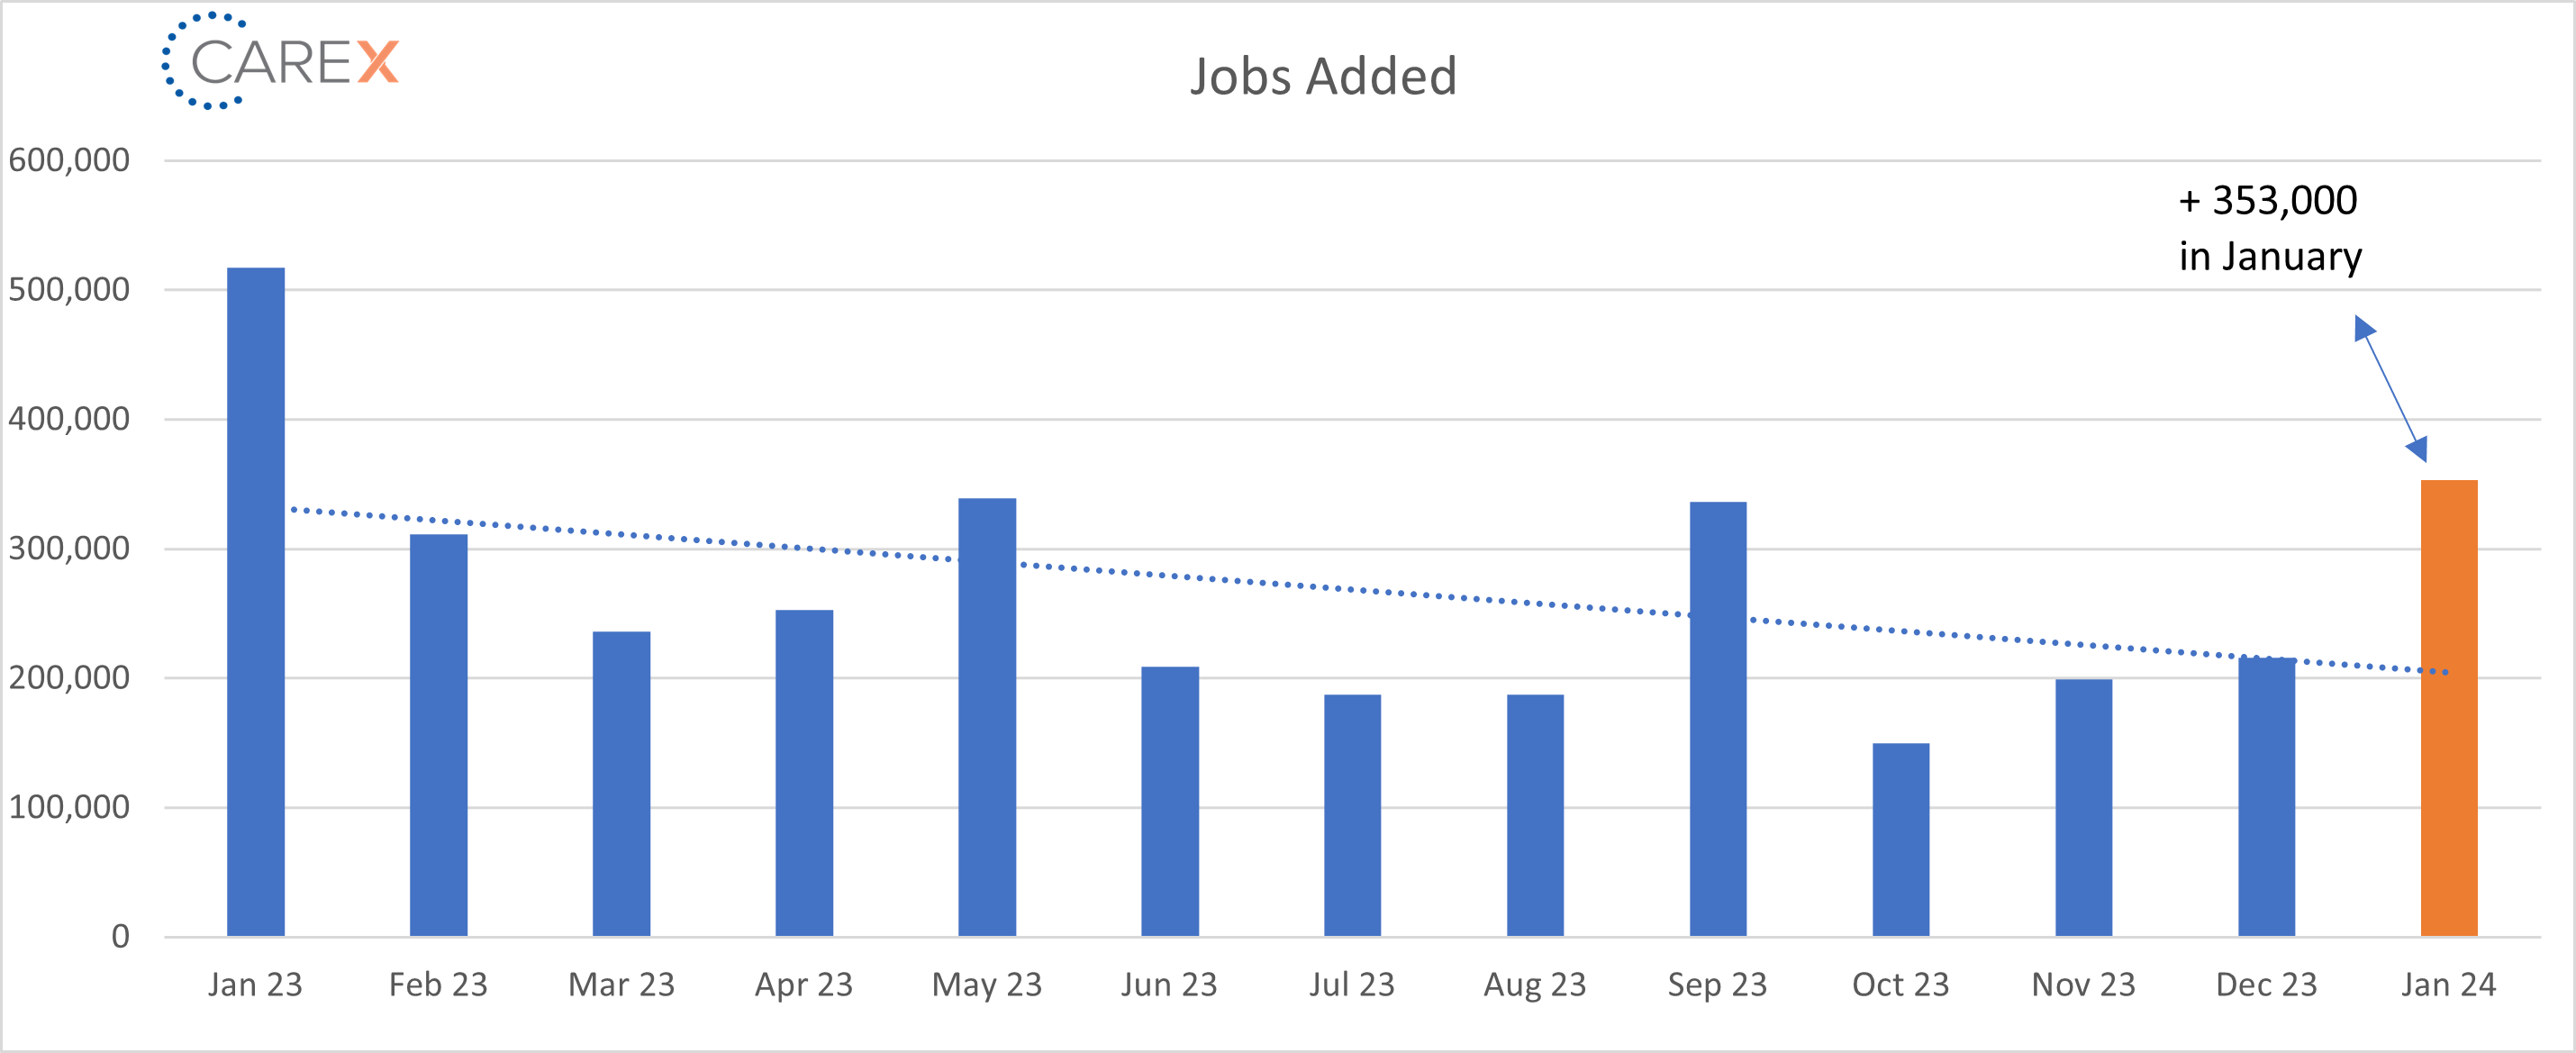
- New Jobs – The U.S. added 353,000 new jobs in January, a surprising announcement that far exceeded expectations (nearly doubling expectations!).
- Notably, job gains were widespread; almost every major sector added jobs in contrast to 2023 where job gains were much more concentrated in healthcare, education, and government.
- Unemployment once again remains unchanged at 3.7%.
- A historically strong level even if it’s a touch higher than the lows of 2023.
- It’s been under 4% for 2 years (a record not seen since the 1960s).
- It hit 14.8% at the peak of COVID.
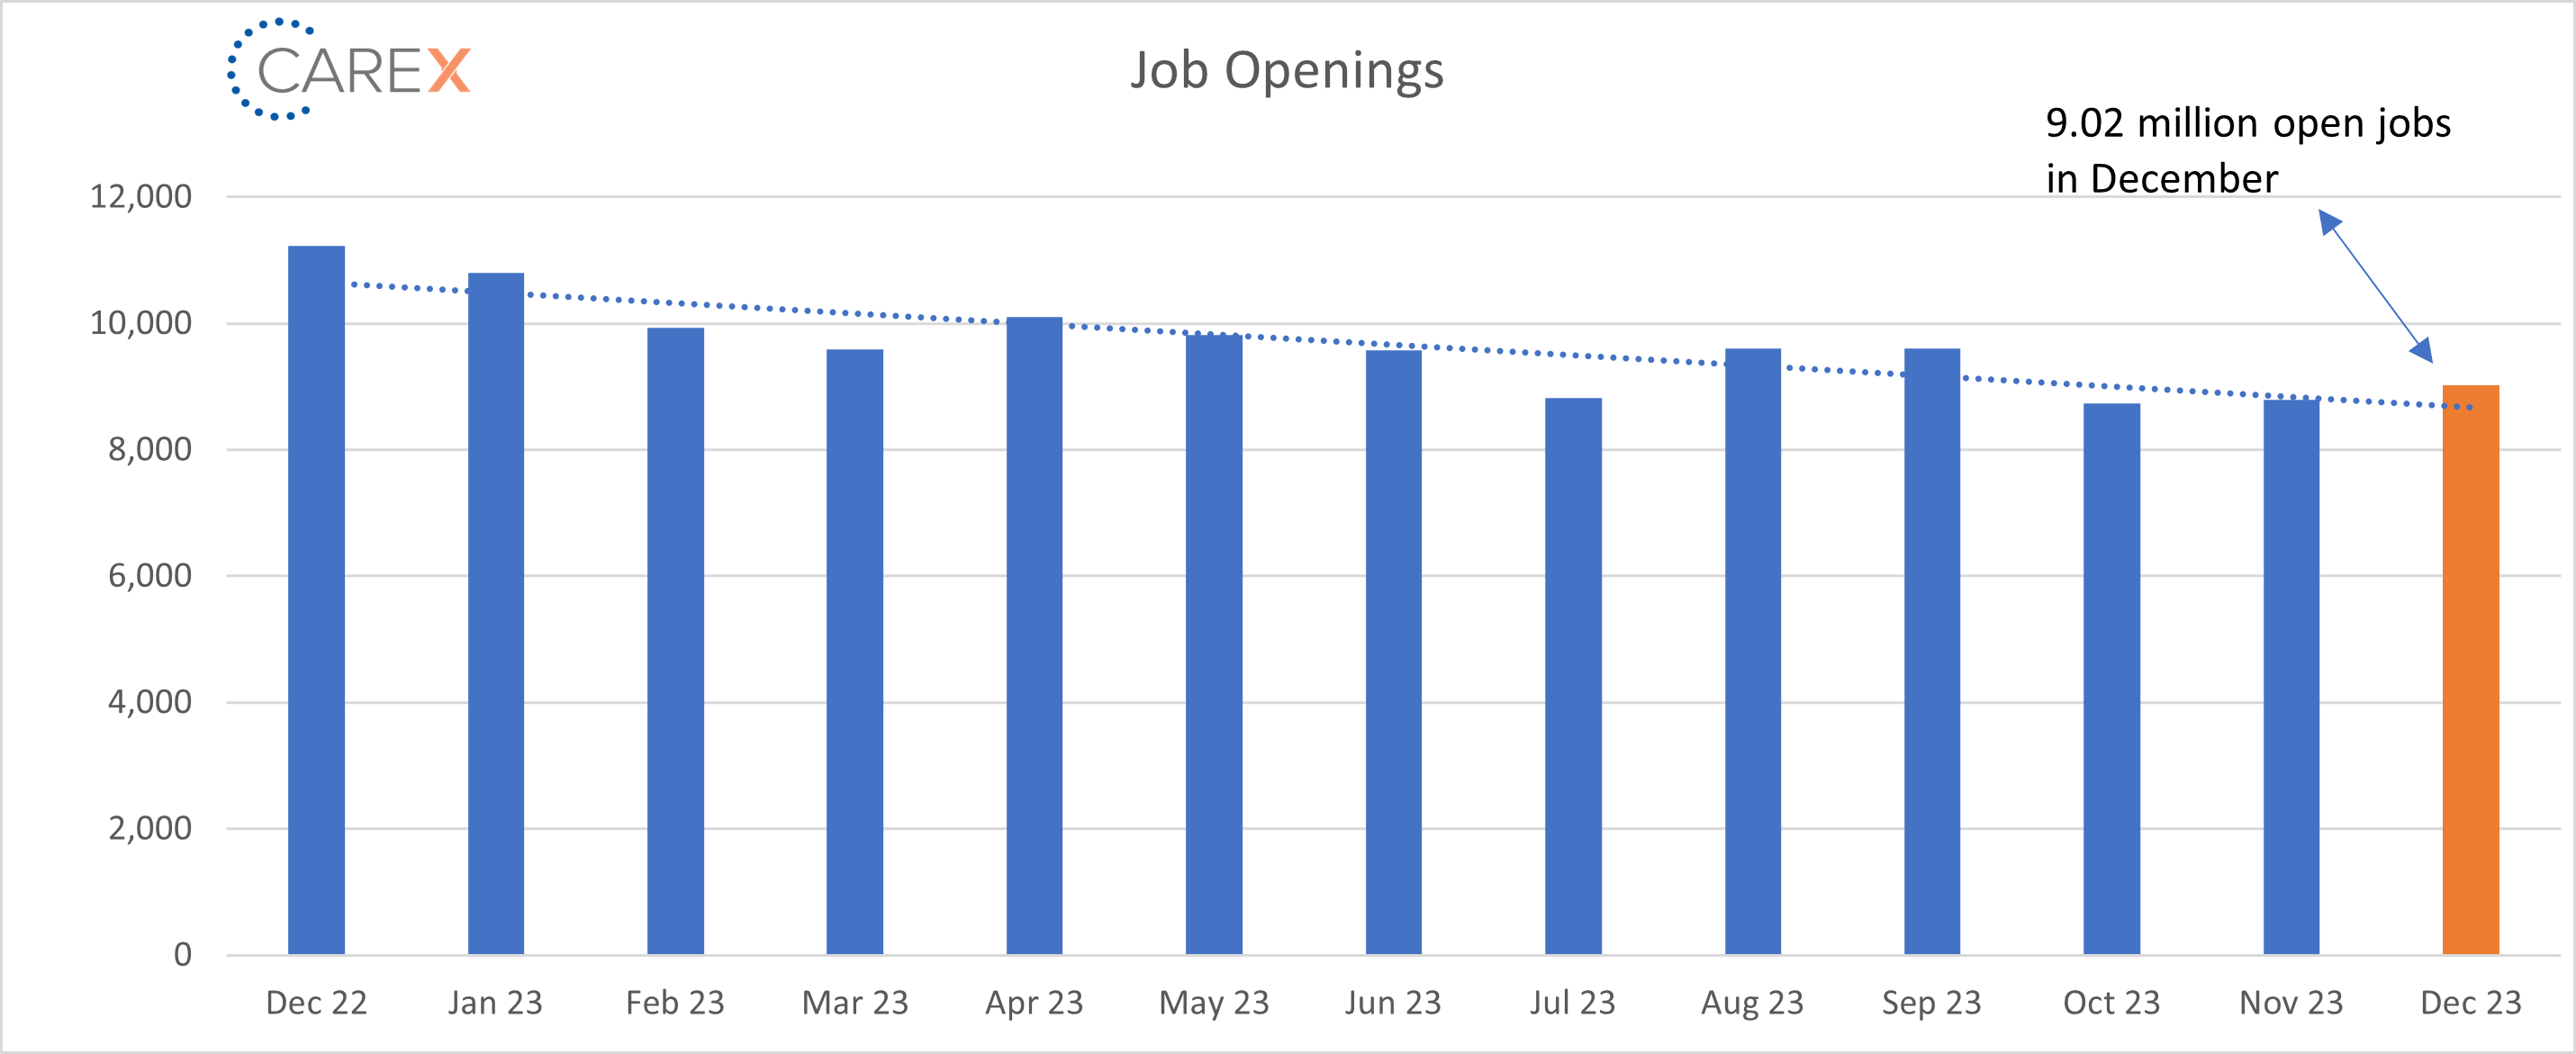
- Job openings jumped to 9.02 million, up from 8.79 million the previous month.
- Job openings peaked at a record 12.0 million in March 2022.
- There were also notable increases in manufacturing, retail trade, healthcare, and social assistance, as well as financial activities sectors.
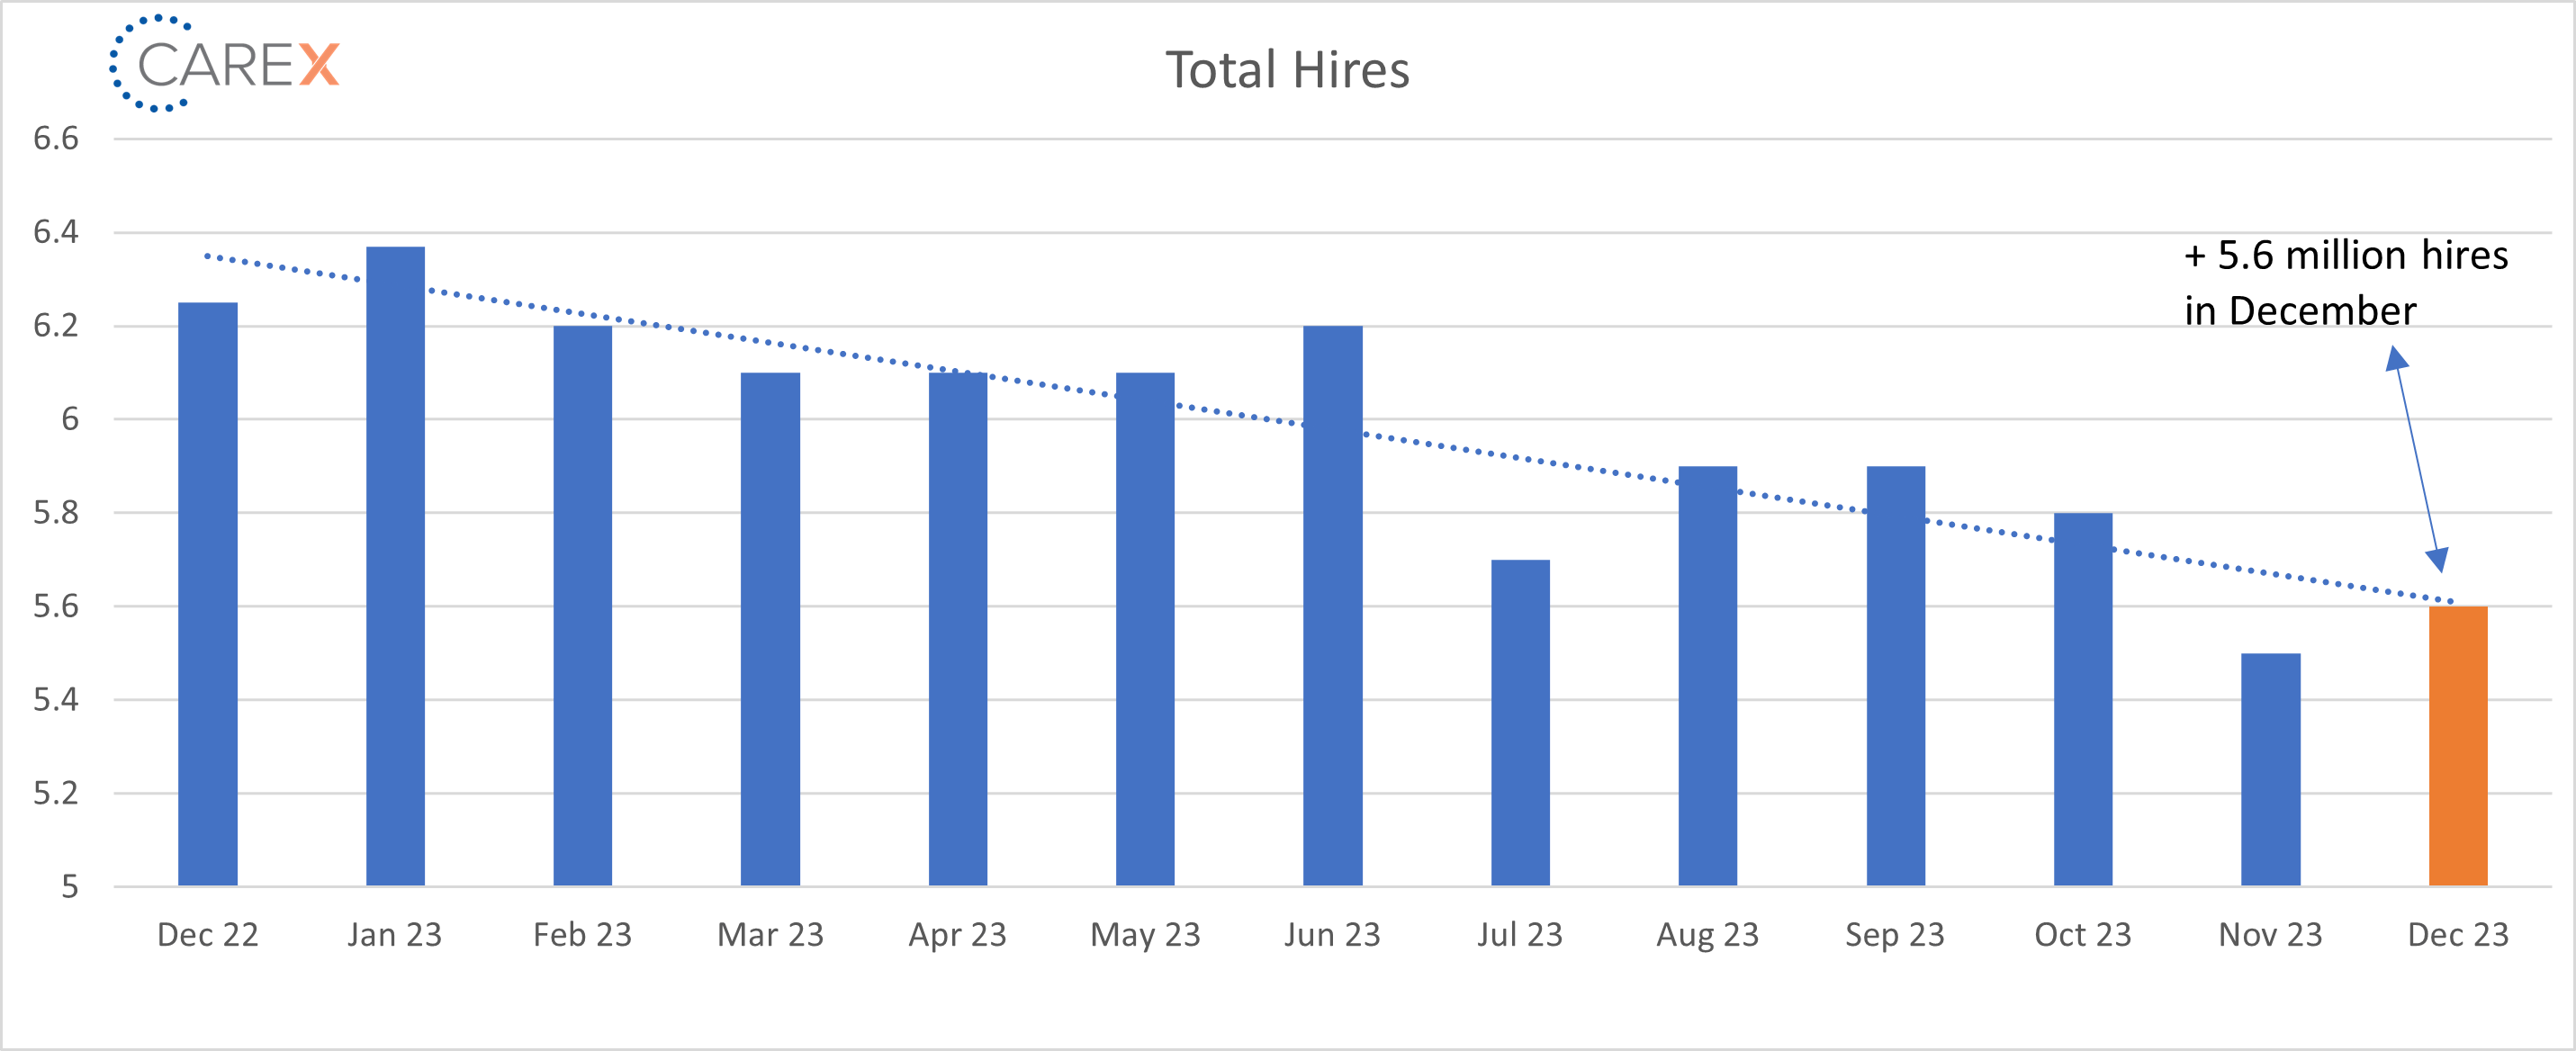
- Hires increased slightly to 5.6 million, up from 5.5 million the previous month.
- Layoffs changed little at 1.6 million, a slight increase from 1.5 million the previous month.
- The layoff rate stayed at 1% for the fourth consecutive month.
- The number of layoffs remains very low by historical standards.
- Quits continued to fall to 3.4 million, down from 3.5 million the previous month.
- Down from 3.6 million two months ago, and 3.7 million three months ago.
- Quits, which are seen as a measure of worker confidence in the ability to change jobs and find another one, continue to remain very steady—and very low.
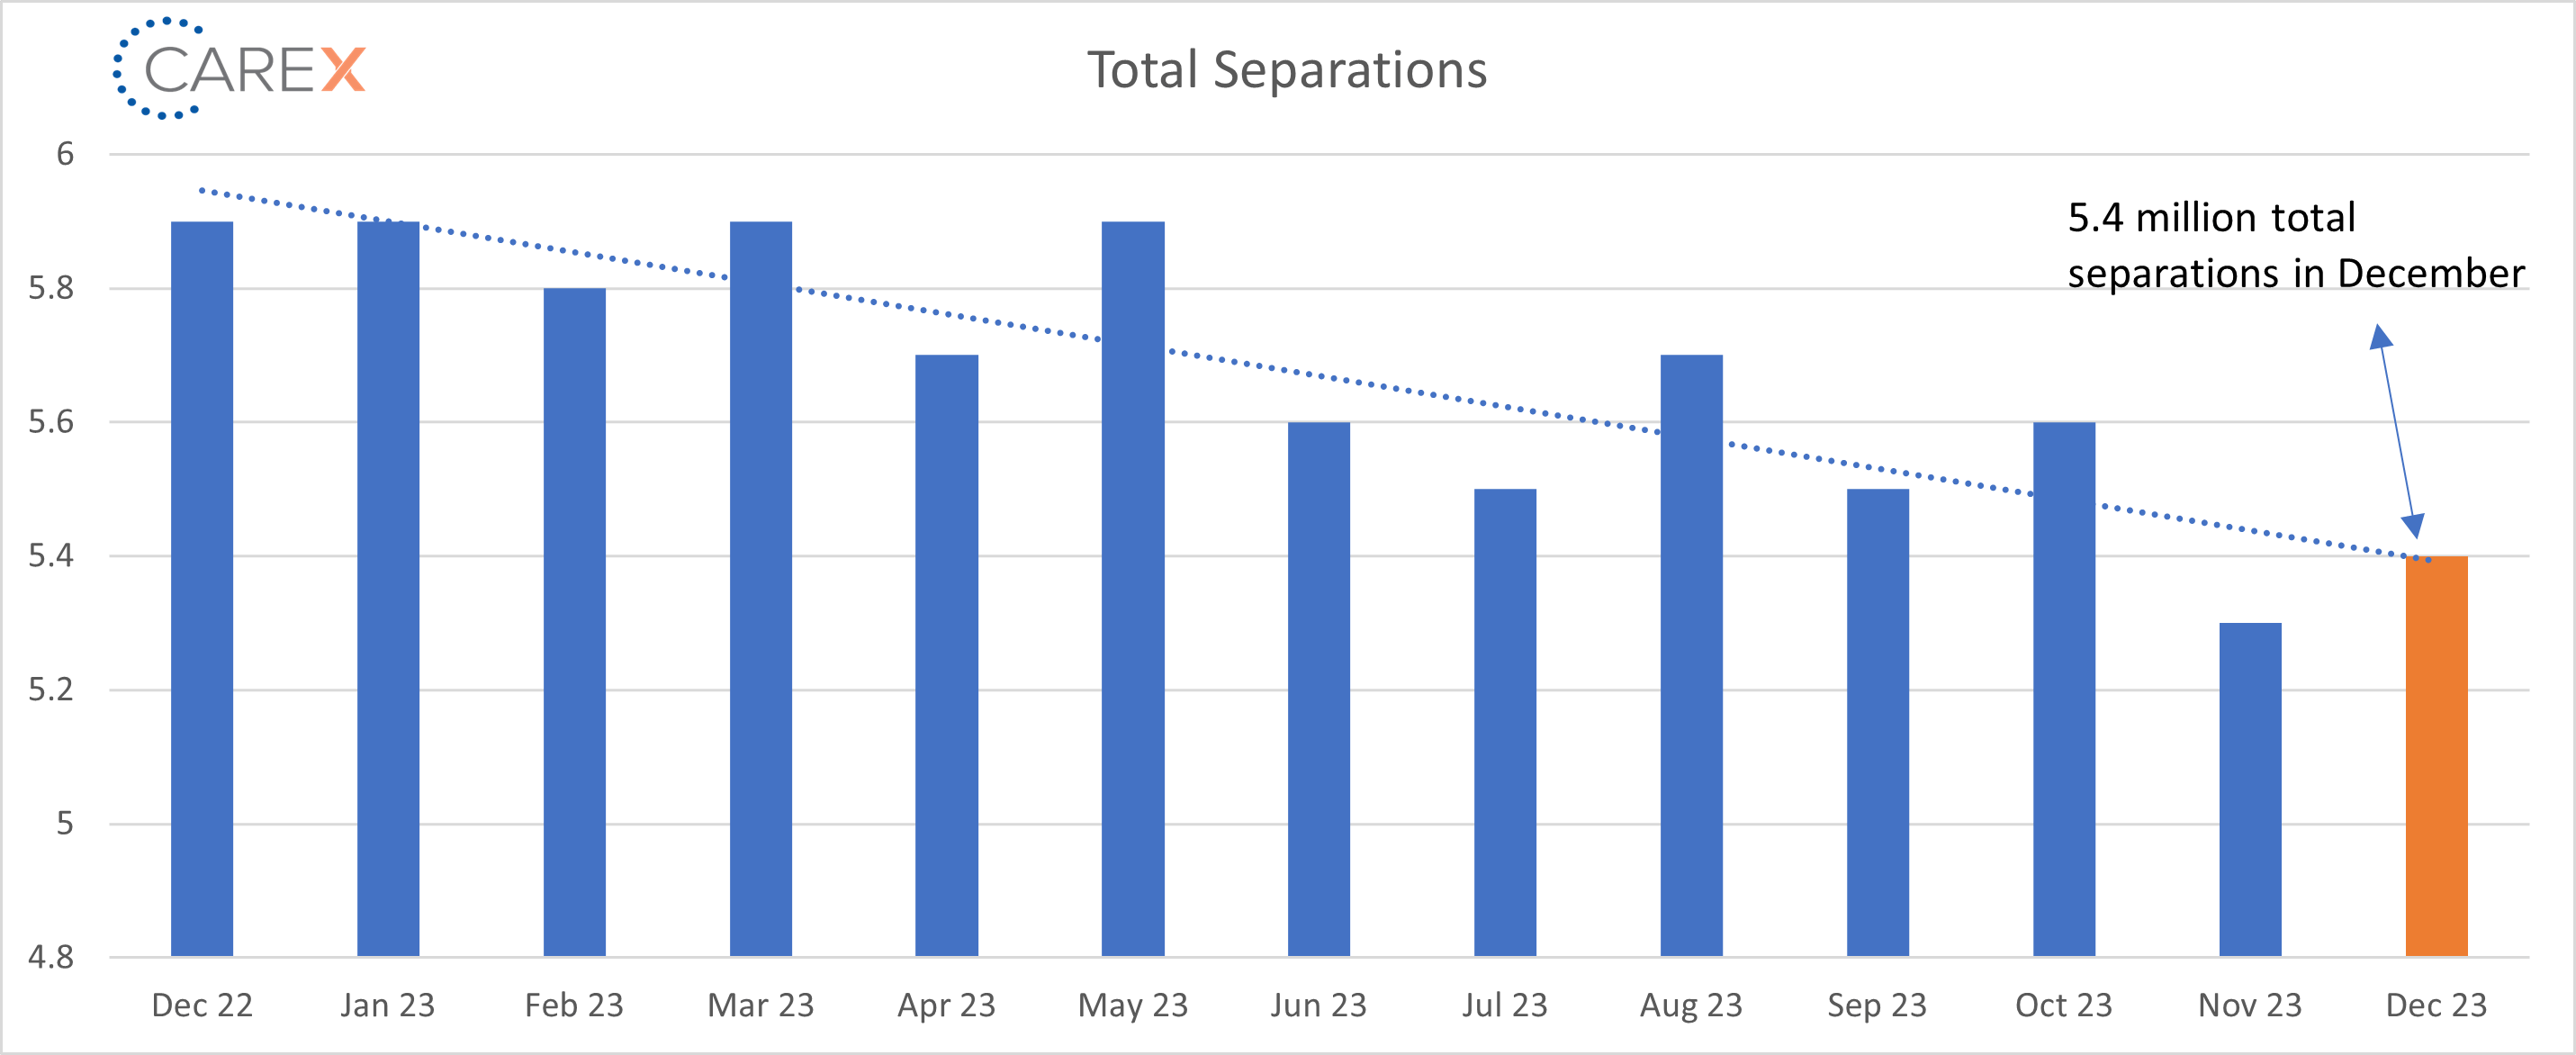
- Total separations increased slightly to 5.4 million, a slight increase from 5.3 million the previous month.
- Down from 5.6 million two months ago.
- A notable continual decline of 5.5 million three months ago, and 5.7 million four months ago.
- Jobs per available worker stayed steady at 1.4:1.
- Noticeably down from 1.8:1 last summer.
- This ratio averaged ~2:1 over the past 2 years.
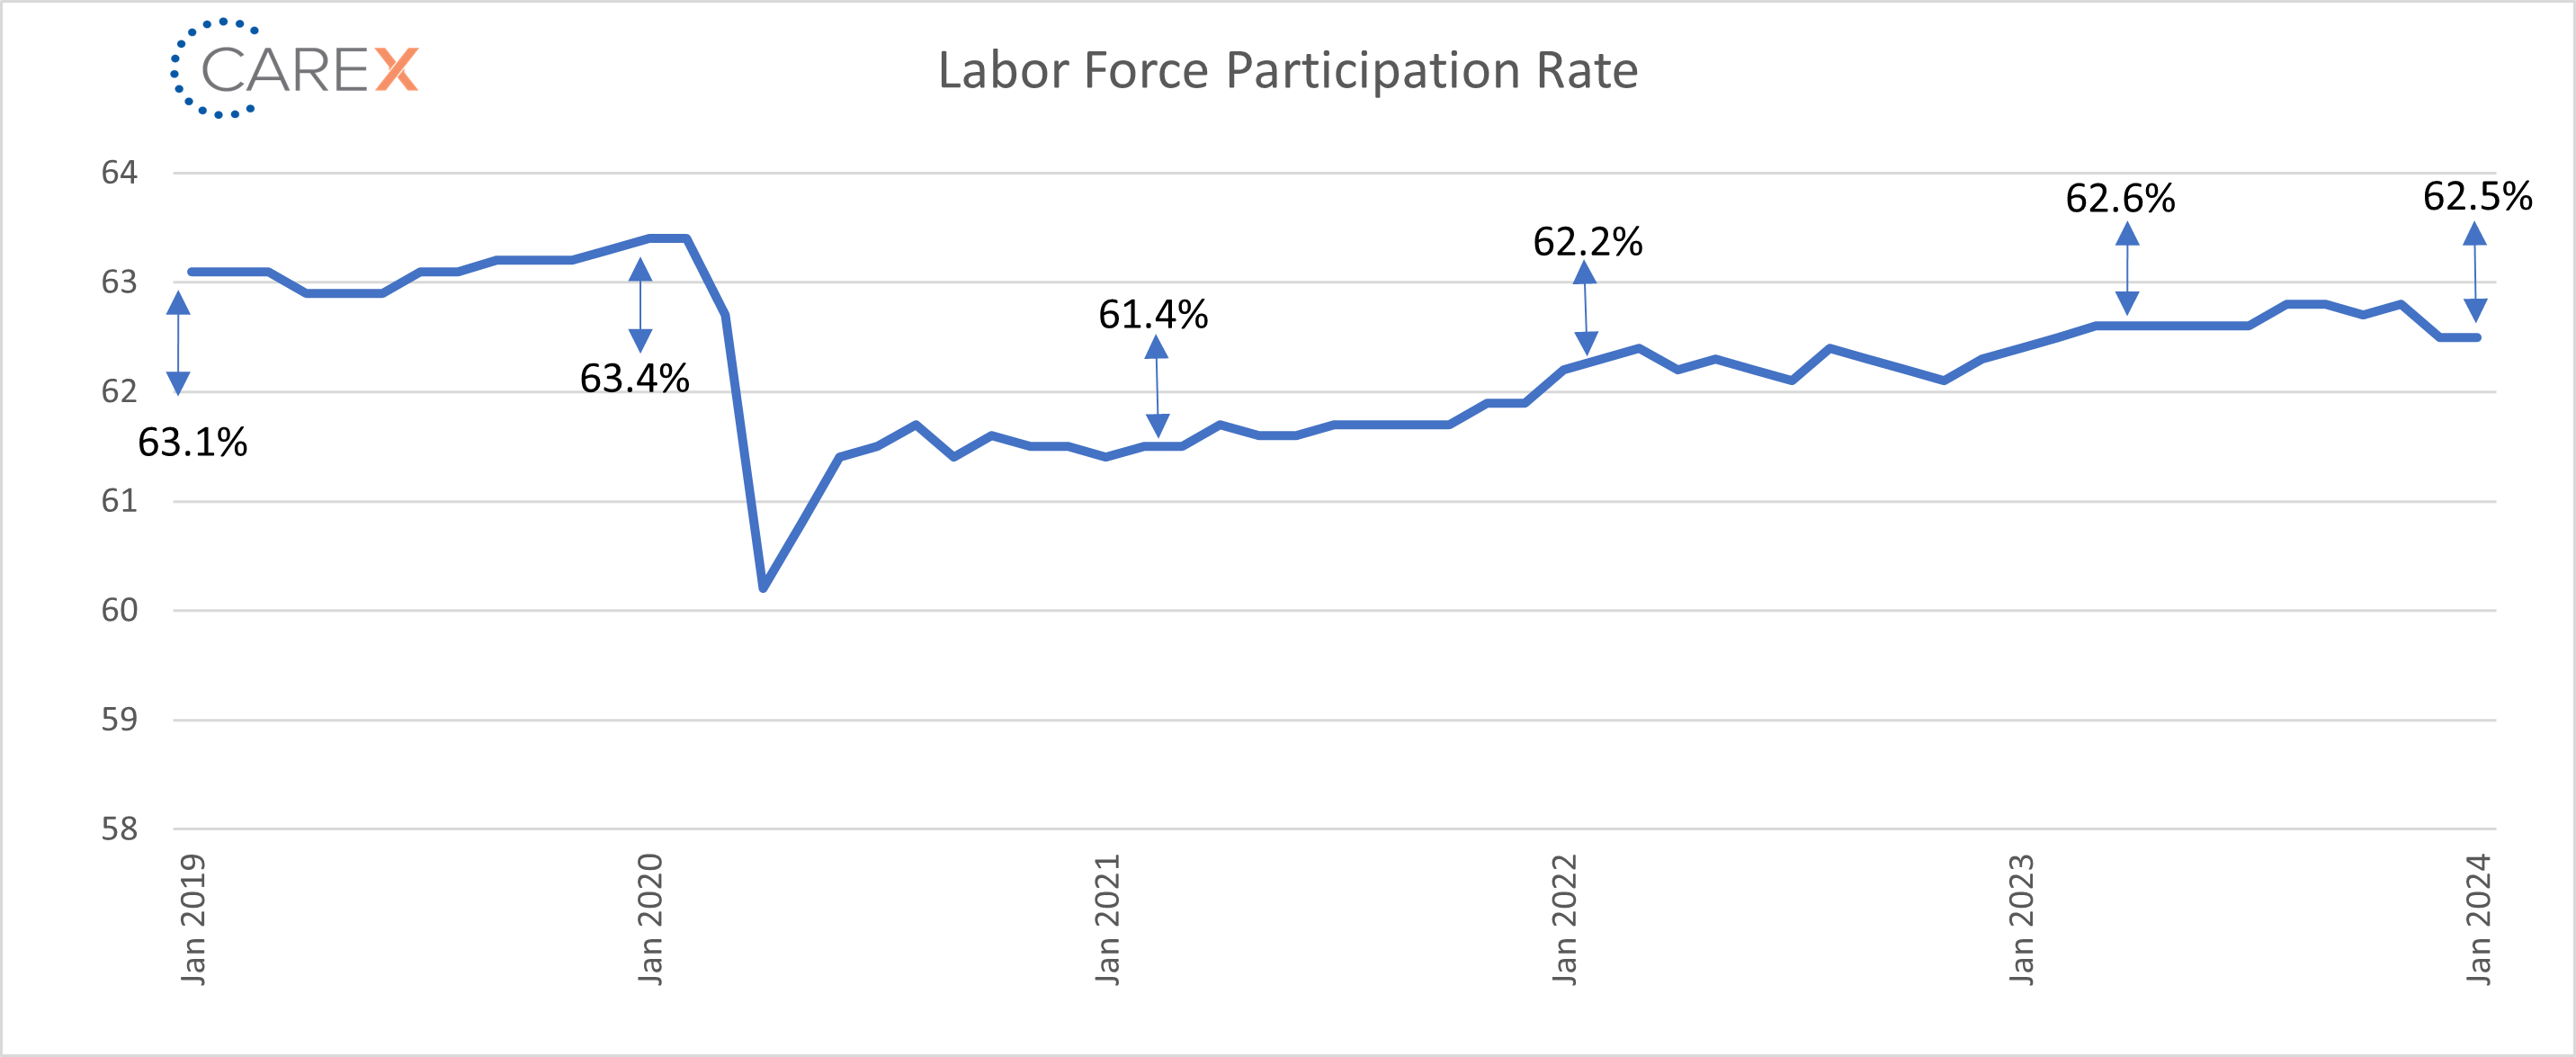
- The Labor Force Participation Rate (LFPR) remained unchanged at 62.5%.
To make sure you never miss a Labor Market Insights update, you can subscribe to receive reminders via email here! While you’re here, make sure to check out the other resources we have available.


