
New job reports were just released! Here’s our labor market insights for April 2025 written by Matt Duffy:
The Labor Market is a lot like the seasons—constantly changing, rarely moving in a straight line, and constantly leaving you asking, “where the hell are we?!” If you live in the Midwest, you know how true this graphic is:

If the Labor Market is seasonal, I think we’re in the Spring of Deception. Things are feeling okay right now—periods of rain and snow (low hiring rate + a spike in layoffs), interrupted by occasional 70-degree sunny days (strong job growth). Given recent and projected labor market activity, I think we’ll need to live through the “third winter,” “the pollening,” and “mud season” before we actually hit Spring. After several months of post-election optimism, we are hitting some headwinds.
Keep in mind, the March jobs figures reflect hiring in March, before the sweeping new global tariffs were announced in April. The BLS/JOLTS data is backward looking and doesn’t say anything about how employers/employees/job seekers might fare over the coming months.
As always, the shiny headline this month will be the impressive number of jobs created in March. If you know me—or have read past reports—you know that I view job creation as one of the least important data sets. I’m not saying it’s useless, but job creation has limited impact if companies aren’t actually hiring people. With that said—it’s notable that the U.S. has now added jobs for 51 months in a row (marking the second-longest expansion on record).
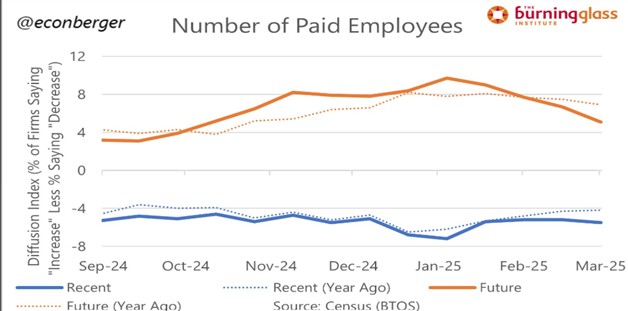
Guy Berger with the Burning Glass Institute recently shared a graph capturing some of the potential hiring headwinds. Labor market optimism surged following the 2024 election, but over the past six weeks, that enthusiasm has increasingly faded. In fact, firms are now more pessimistic about their future workforce than they were before the election. And it’s not just future hiring plans that are declining—for the first time since the election, companies are also reporting actual reductions in their staff. Granted, cutbacks/layoffs are largely being driven by the DOGE shakeup—in the March Challenger report, total announced layoffs were 275,240, of which 216,915 were in government, or 78.8% of the total. It’s also worth noting that federal layoffs for the month were up 672% from a year prior. These comments are in no way meant to support or criticize these actions, but rather to spotlight the short-long-term impact this may have on the labor market.
This month’s labor market data (below) feels a bit like the Spring of Deception. The next few months should solidify if we jumped right to Spring, or if we ended up in the Third Winter.
By the numbers:
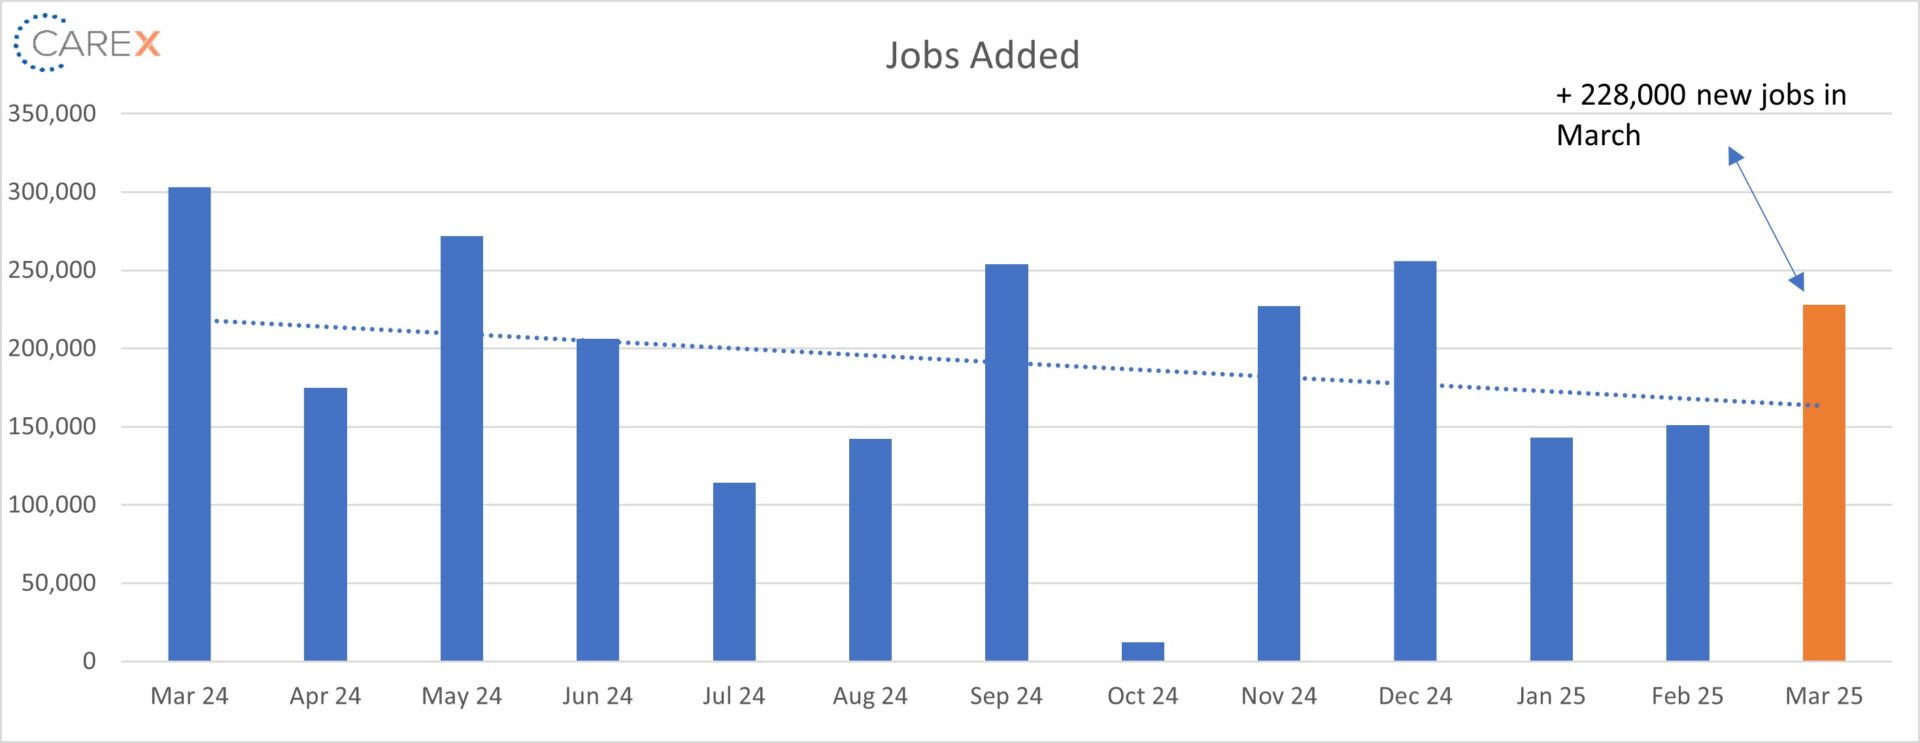
- New Jobs – the U.S. added 228,000 new jobs in March.
- The biggest driver of job growth was Healthcare and Social Assistance, adding 78,000 jobs (these sectors have accounted for about 45.6 percent of all jobs added over the past year).
- Professional and business services, a sprawling sector that includes lawyers, architects, and other white-collar workers, added just 3,000 jobs.
- Unemployment ticked up to 4.2%, up from 4.1% the previous month.
- The first time since 2021 unemployment has been at or above 4% for ten consecutive months.
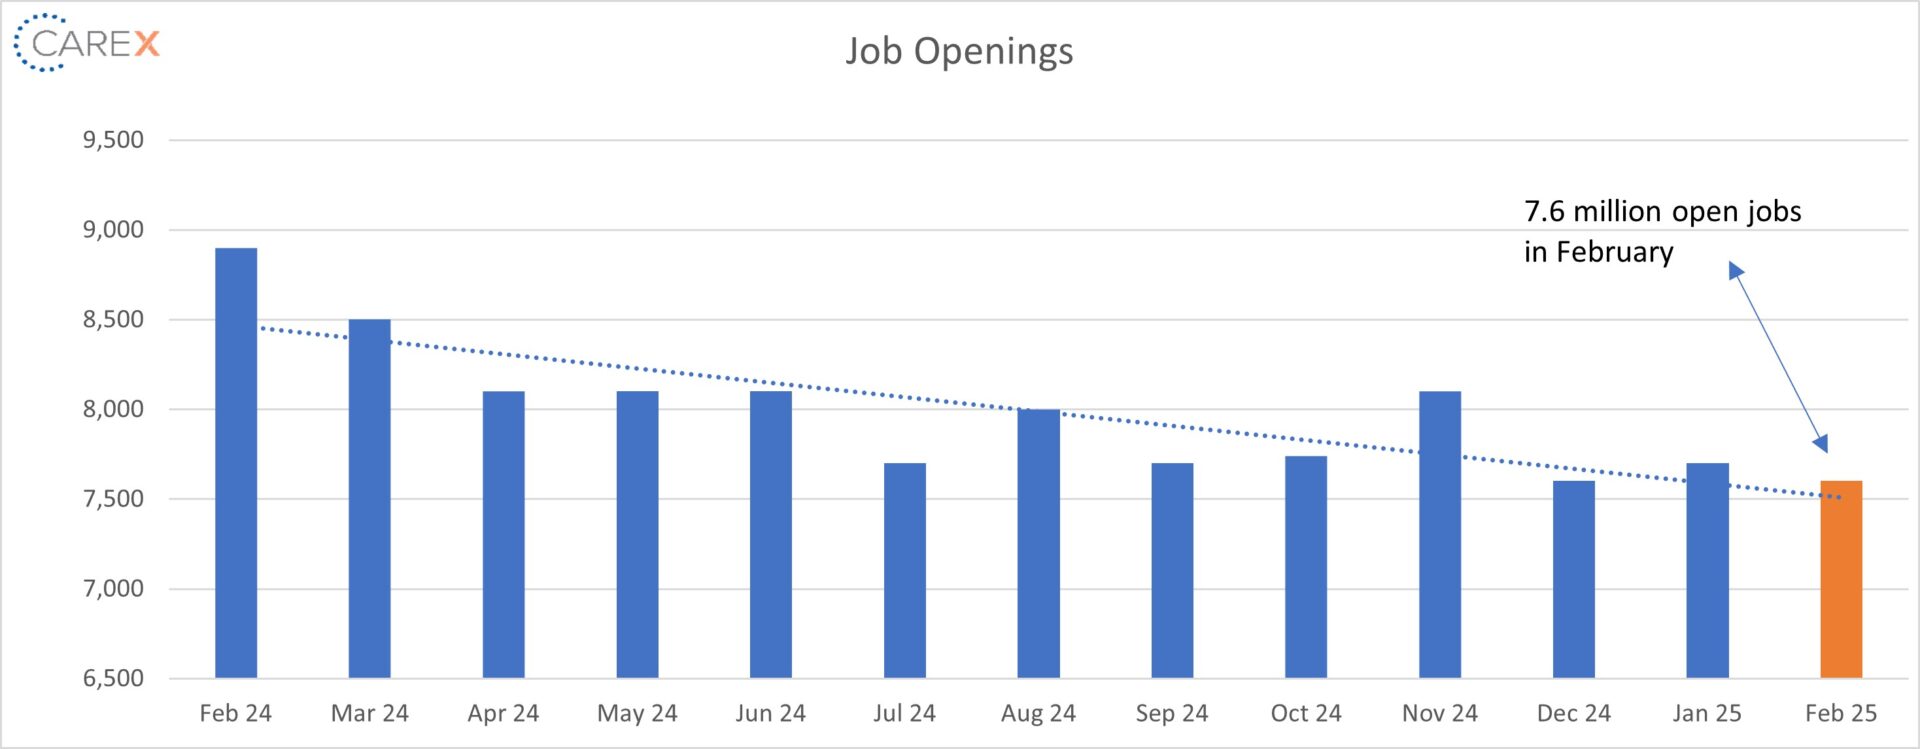
- Job openings dropped slightly to 7.6 million, down from 7.7 million the previous month.
- Down by 877,000 over the year.
- The 6th consecutive month job openings were below 8 million.
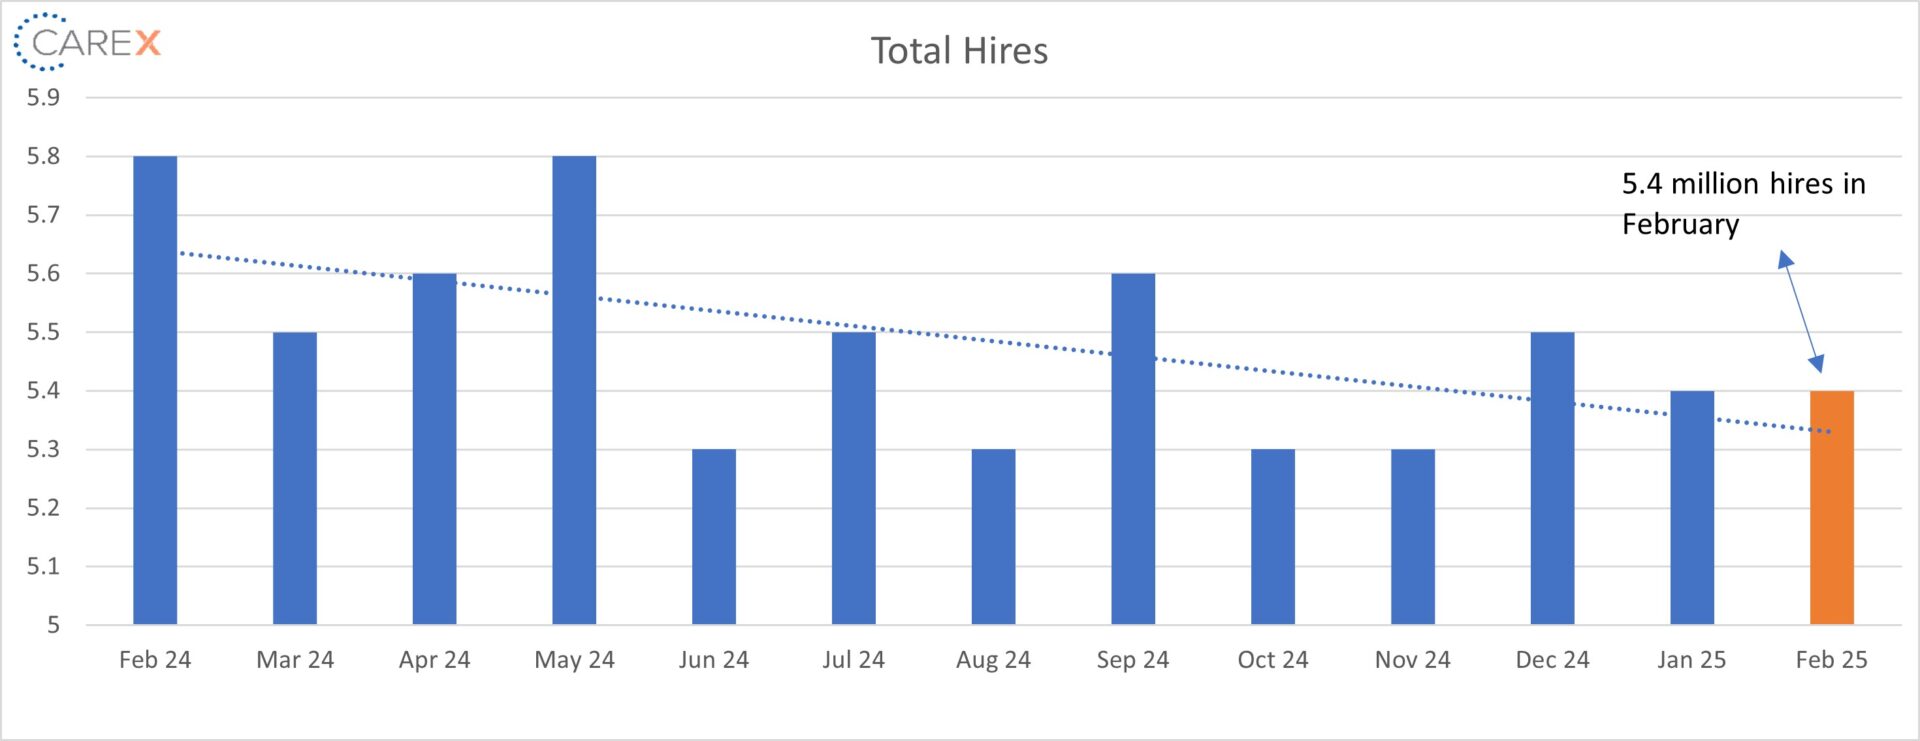
- Hires were unchanged, standing at 5.4 million.
- Down from 5.7 million this time last year.
- Layoffs increased slightly to 1.8 million, down from 1.6 million the previous month.
- Layoffs increased in retail trade (+67,000), real estate and rental and leasing (+24,000), and federal government (+18,000).
- Cuts within the Federal Government haven’t fully been captured in this month’s report.
- Quits decreased slightly to 3.2 million, down from 3.3 million the previous month.
- Quits, which are seen as a measure of worker confidence in the ability to change jobs and find another one, continue to remain very steady (and very low).
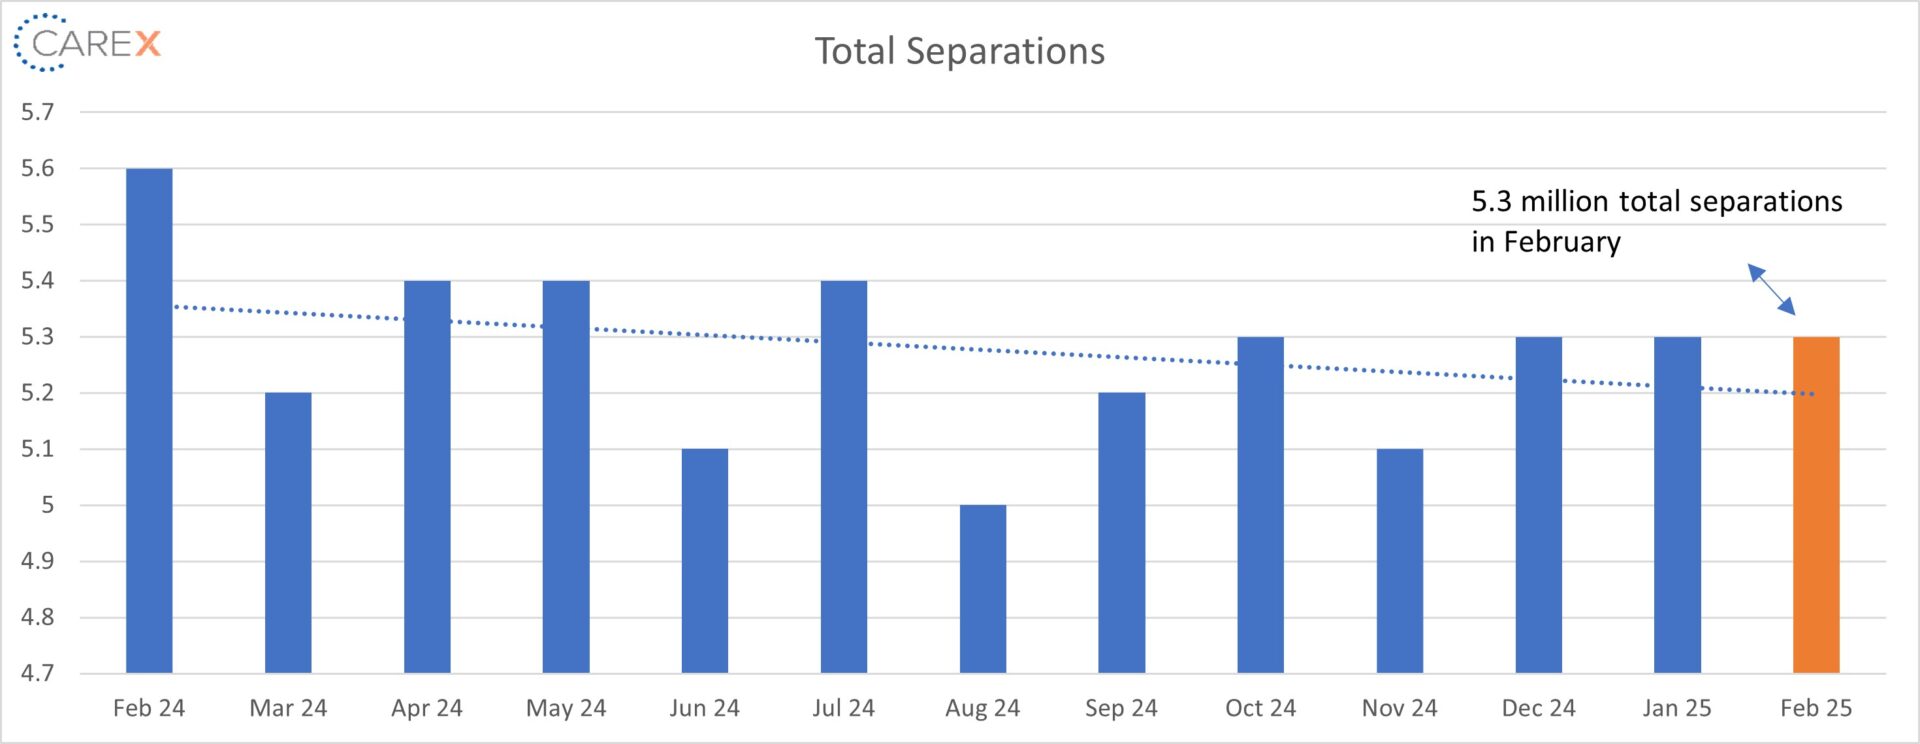
- Total separations remained steady at 5.3 million.
- Total separations have remained steady for the past 12 months.
- Jobs per available worker held steady for the fifth consecutive month at 1.1:1.
- At its peak in 2022, the ratio was 2:1.
- Labor Force Participation Rate (LFPR) increased slightly to 62.5%, up from 62.4% the previous month.
- It hit a high of 67.3% in early 2000 and fell to 63.3% in the month before the onset of the pandemic.
To make sure you never miss a Labor Market Insights update, you can subscribe to receive reminders via email! While you’re here, make sure to check out the other resources we have available.