
New job reports were just released! Here’s our labor market insights for August 2024.
Key Takeaways:
Looking good, feeling bad. It’s an odd contradiction, but that’s exactly how I define the current labor market. Part of the problem is unemployment – for example, there are 1.2 million more unemployed people today compared to this time last year.
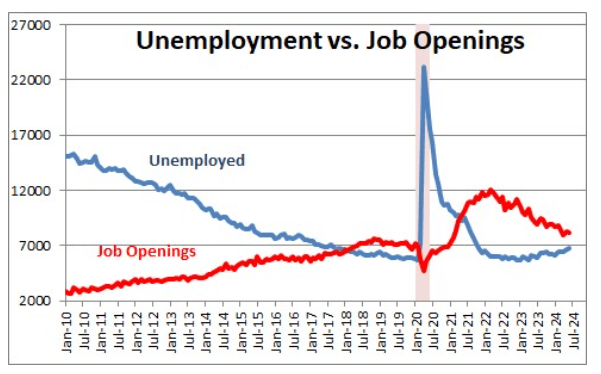
One graph/data point rarely tells the entire story. But the unemployment vs. job openings landscape is always a good starting point. At the risk of oversimplification – I call this the ghostbuster line (“don’t cross the streams!”); the closer the red and blue line get, the more turmoil we see in the labor market. As you can see, we’re moving in the wrong direction.
Let’s review what’s happening.
The labor market is like a swinging pendulum – it’s constantly moving and providing frustration and/or relief depending on the audience. If the labor market is tight, it increases the mood of job seekers/candidates, while frustrating companies looking to hire. For example:
- Job Seekers/Candidates: Lots of jobs + low unemployment + minimal layoffs = easier to find a job!
- Companies/Hiring Managers: Higher unemployment + limited jobs + increasing labor force participation = easier to hire employees!
Historically, when one audience is happy, the other isn’t. However, we’re in a unique environment where ALL audiences are frustrated. While the labor market “appears” to be in good shape – it’s not a great environment for job seekers/changers, and it’s an equally tough environment for companies to hire quality candidates. Huh?!
There are more job openings (~8 million) than unemployed people (~7 million) – that’s good for job seekers, right? Nope.
Companies are creating a record number of new jobs, unemployment remains historically low, and the labor force participation rate remains very high – that’s good for companies hiring employees, right? Nope.
Why?! Companies are receiving on average 250 applications per open job, yet managers/leaders continually express frustration with candidate/skills misalignment (and the average time to fill is ~11-weeks!). And even with over 8 million open jobs, candidates are experiencing a difficult environment to find a job.
There are several key labor market indicators – unemployment, layoffs, job creation, open jobs, etc. – that paint a picture of the labor market. Overall, all these factors combined paint a generally positive picture. Looking at a few of the popular top line numbers:
- Unemployment: 4.3% (not great, but definitely not bad), and before 2-months ago, it’s been under 4% for 28 months (a record not seen since the 1960’s)
- Job Creation: through the first half of the year, the US has added ~1.3 million jobs (an average pace of ~200,000 per month)
- Layoffs: The layoff rate has stayed at ~1% for the 10 consecutive months; contrary to many headline stories, layoffs remain very low by historical standards
- Job Openings: Have been above 8 million since the pandemic recovery
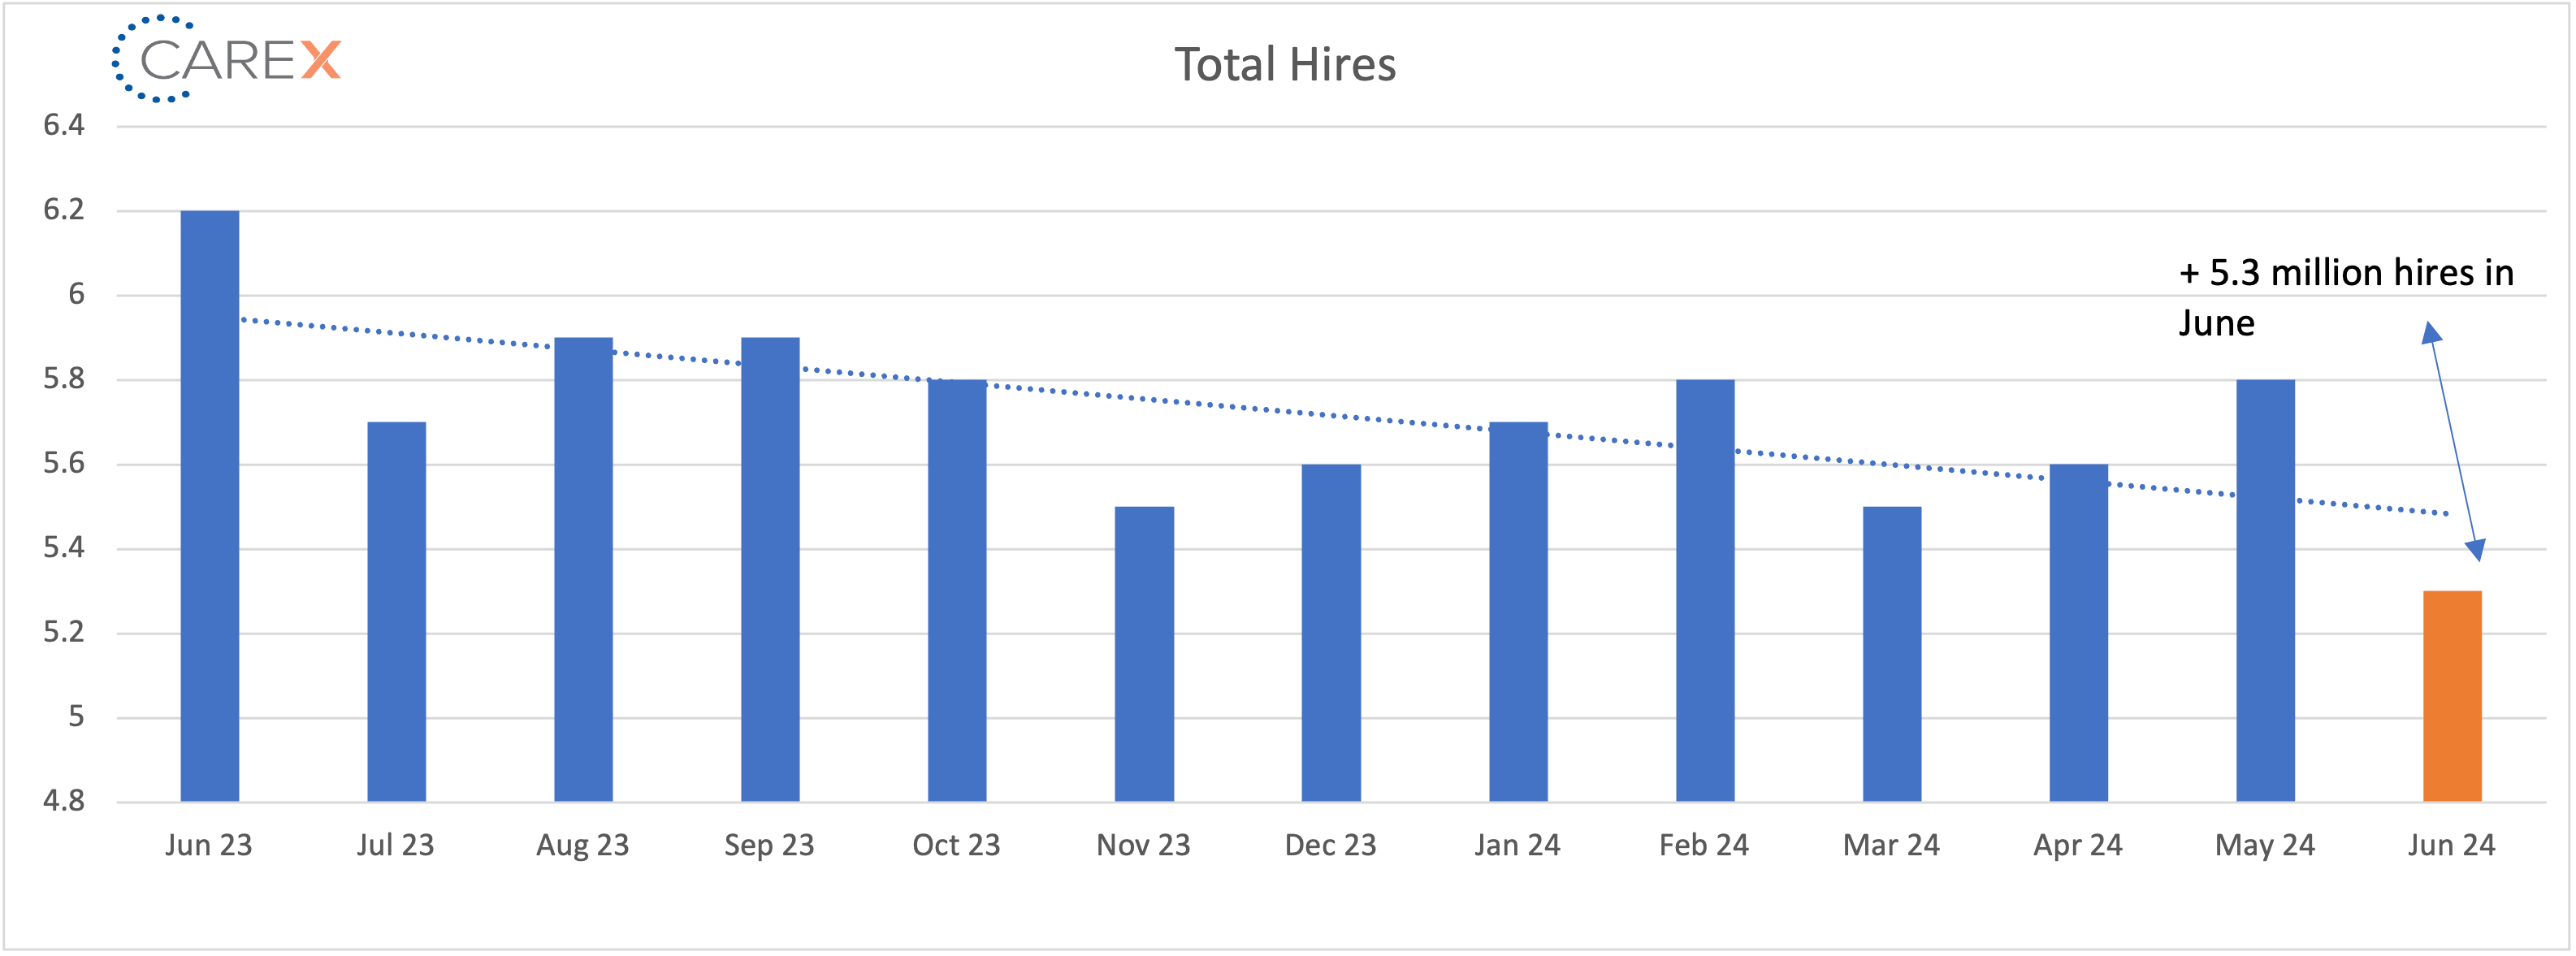
So, where’s the disconnect? Why is it job seekers are having such a difficult time finding role when the data looks so encouraging? In short – while most of the labor market indicators signify optimism (or at a minimum, stabilization), the key indicator that matters most to job seekers is showing signs of distress – hires. There were 5.3 million hires in June, 314,000 fewer than in May. The rate of hiring, at 3.4% of total employment, is the lowest since March 2020. Compounding this troubling data point is unemployment. This time last year unemployment was 3.6% (~6 million people).
There’s an influx of unemployed (and employed) individuals vying for fewer jobs in a market when companies continue to hire at a very low rate. Additionally, many of the positive labor market indicators are being buoyed by just three industries – Leisure and Hospitality, Government, and Healthcare and Social Assistance. Job seekers – particularly outside of these industries – are likely experiencing a difficult path.
So, what happens if something/someone looks good but feels bad? We all know this to be true – looks don’t matter, the truth is in the feeling. The labor market is cooling off and we all need to grab a sweater. The rest of the year could be a cold and bumpy ride.
By the Numbers:
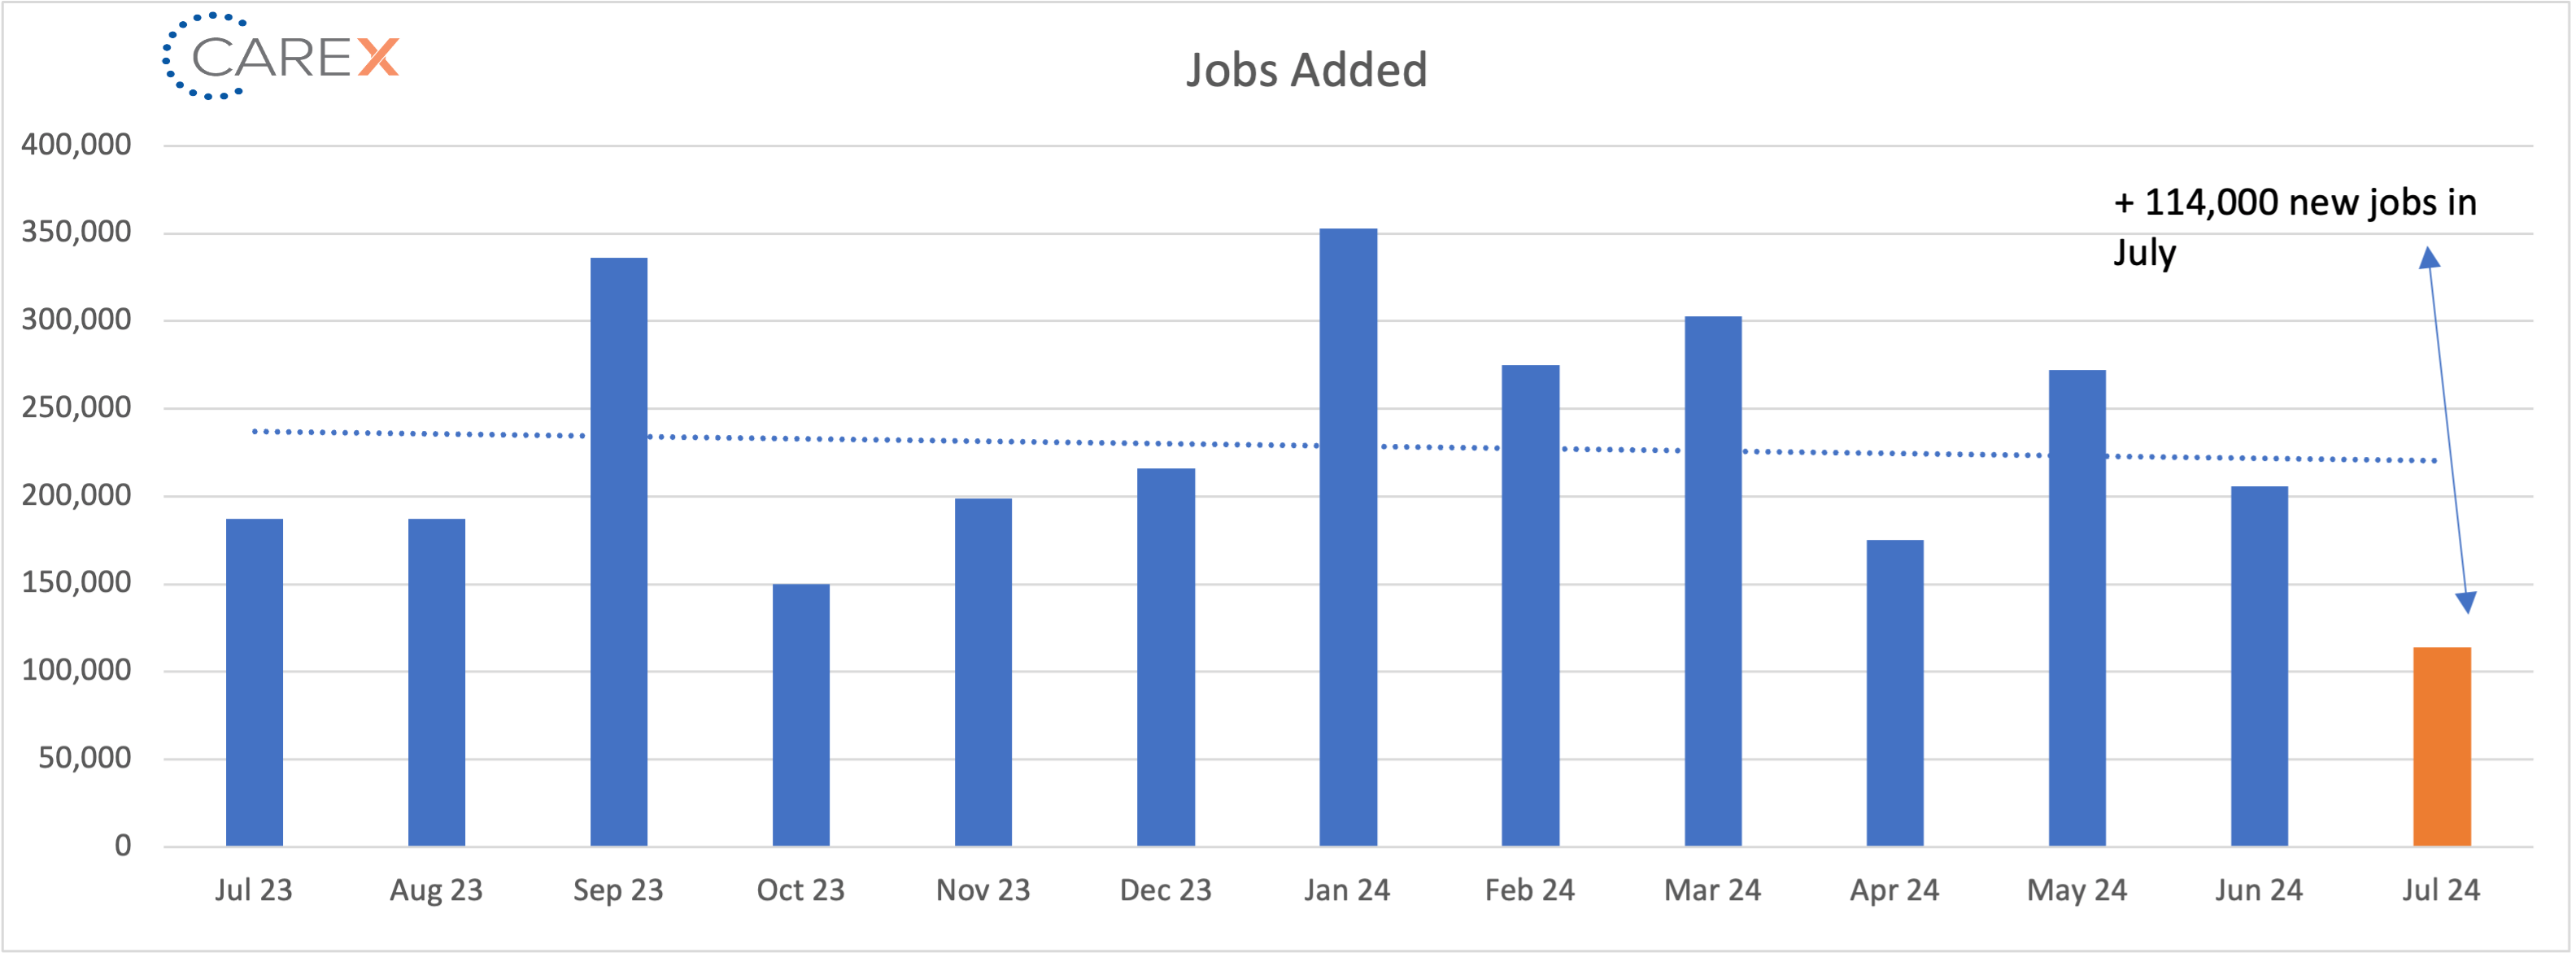
- New Jobs – The U.S. added 114,000 new jobs last month
- Well below the average of 215,000 over the past 12 months
- Information Services sector posted a loss of 20,000
- Health care led the way, adding 55,000 jobs
- Other notable gainers included construction (25,000), government (17,000), and transportation and warehousing (14,000)
- Unemployment rose – again – to 4.3%, up from 4.1% the previous month
- The highest rate since October 2021
- The number of unemployed people jumped 352,000 over last month
- There are 1.2 million more unemployed people today compared to this time last year
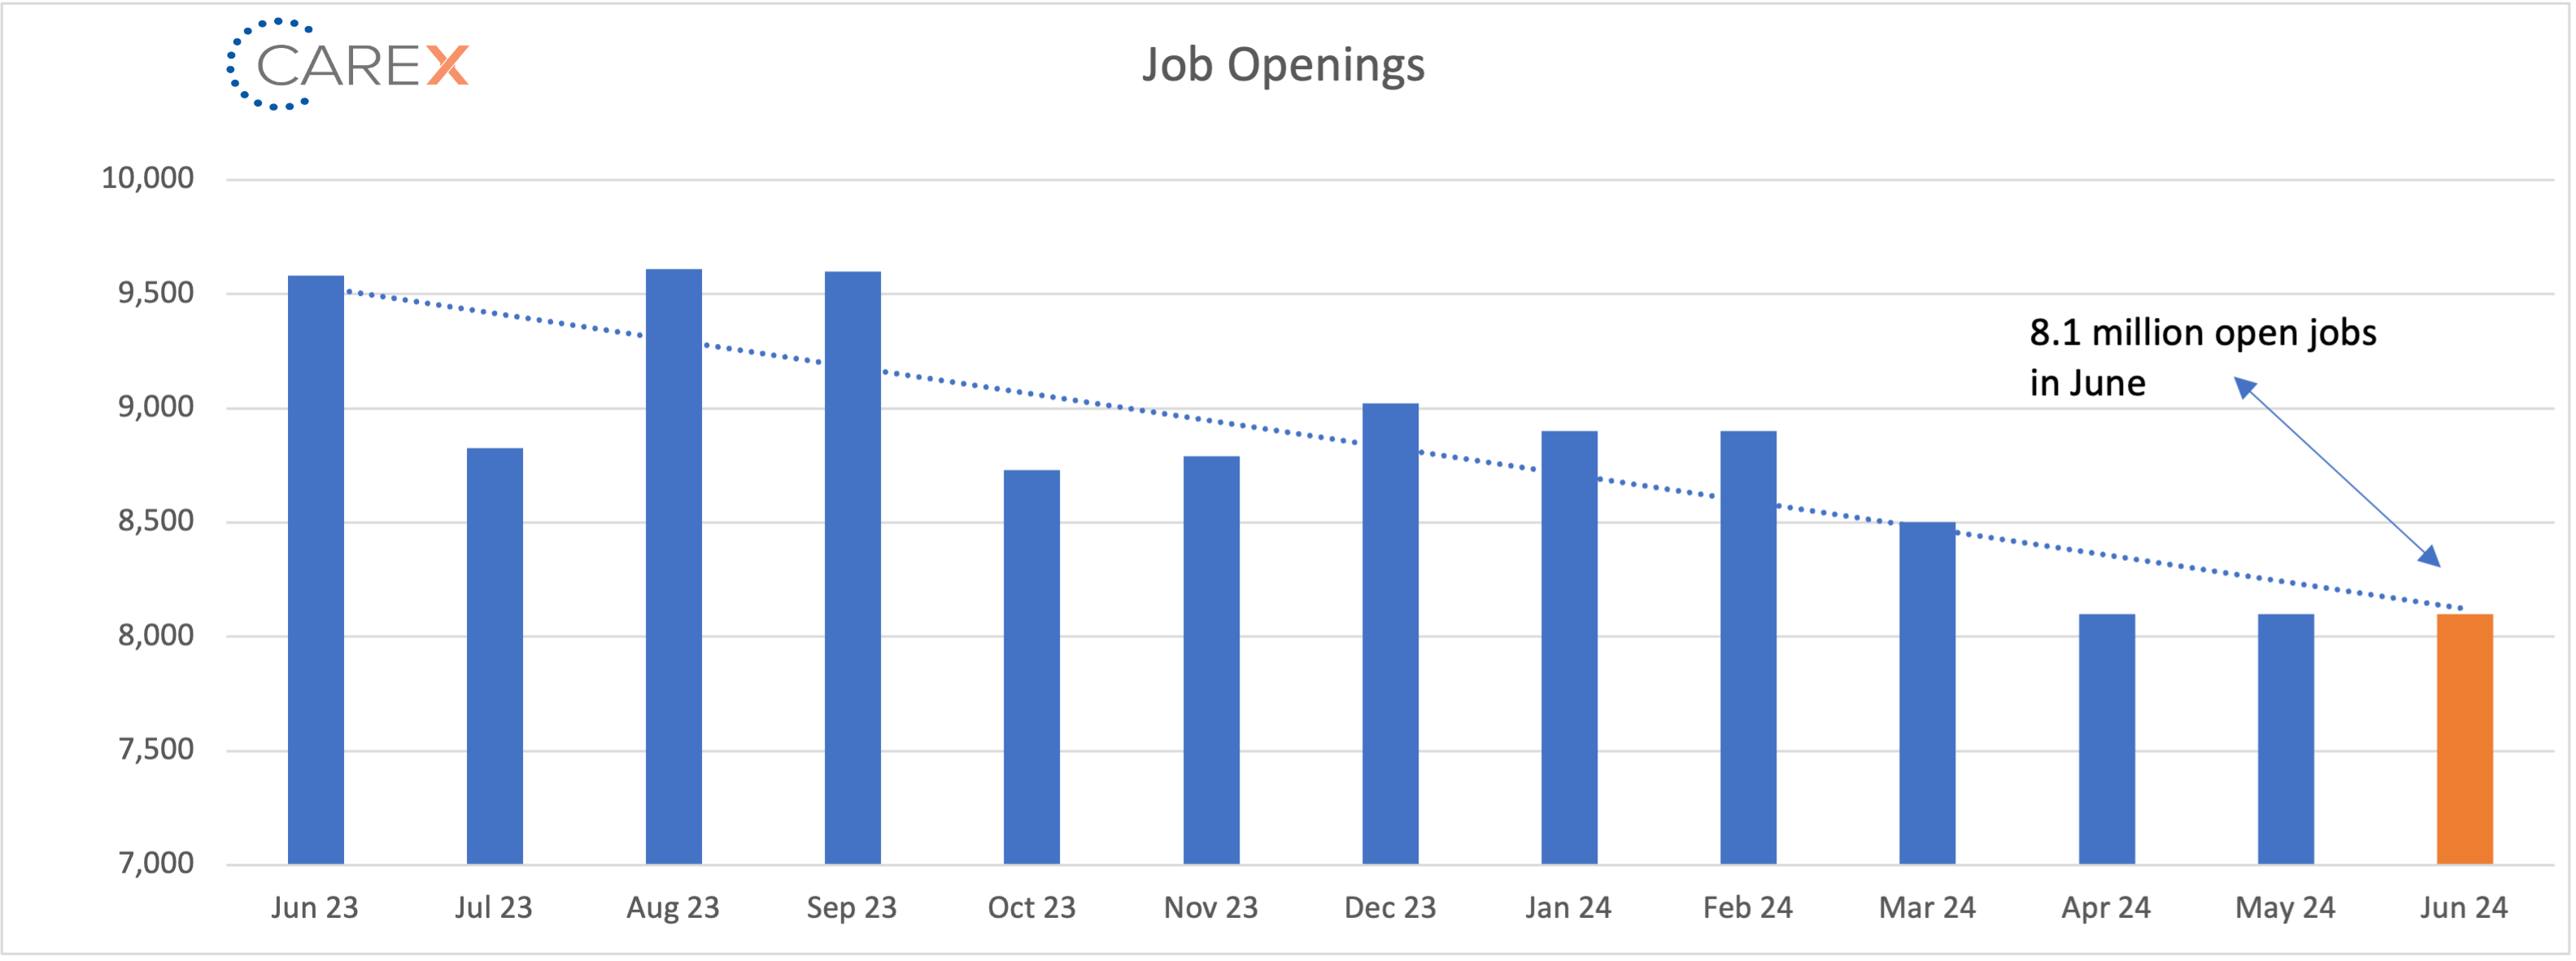
- Job openings remain unchanged for the third straight month at 8.1 million
- The lowest rate since February 2021
- Hires decreased slightly to 5.3 million, down from 5.8 million the previous month
- Down from 6.2 million this time last year
- Layoffs dropped to 1.5 million, down from 1.7 million the previous month
- The layoff rate stayed at ~1% for the 10th consecutive month
- Unfortunately, the tech sector lost steam and cut ~7k jobs this month
- The number of layoffs remain very low by historical standards
- Quits dropped to 3.3 million, down slightly from 3.5 million the previous month
- Quits, which are seen as a measure of worker confidence in the ability to change jobs and find another one continues to remain very steady – and very low
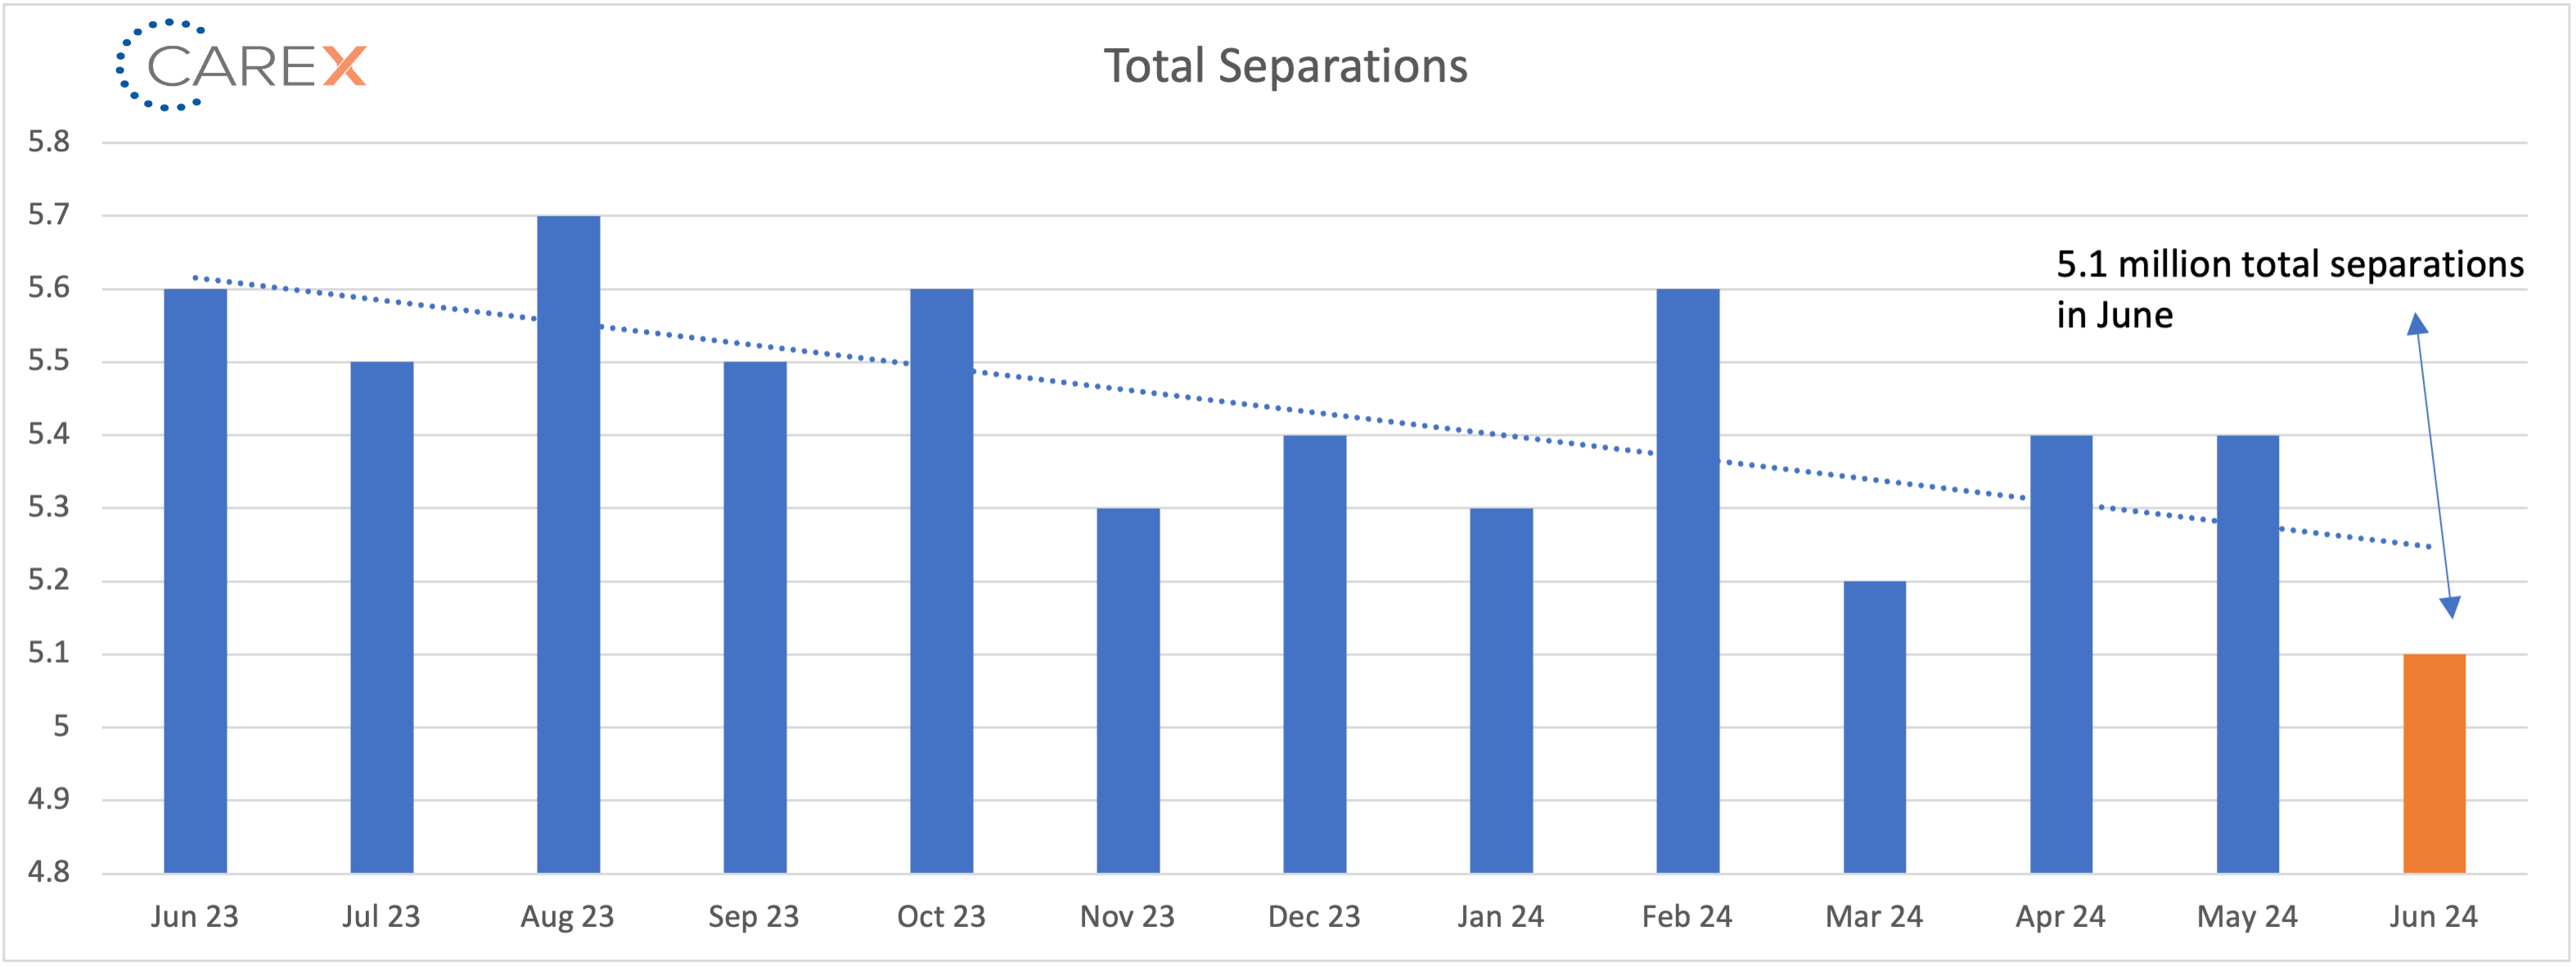
- Total separations fell slightly to 5.1 million, down from 5.4 million the previous month
- Separations have stabilized across all industries, notably the tech sector
- Jobs per available worker held at 1.2:1
- Noticeably down from 1.8:1 last summer
- This ratio averaged ~2:1 over the past 2-years
- LFPR (labor force participation rate) ticked up to 62.7%, up from 62.5% last month
- It hit a high of 67.3% in early 2000 and fell to 63.3% in the month before the onset of the pandemic
To make sure you never miss a Labor Market Insights update, you can subscribe to receive reminders via email here! While you’re here, make sure to check out the other resources we have available.