New job reports were just released! Here’s our labor market insights for December 2024 written by Matt Duffy:
I’ll be brief with this month’s Labor Market summary (it’s mostly a “meh” month of data) before sharing some data/thoughts on 2025.
Somewhat surprisingly, most headlines this month tell a story of a “stable” labor market. The overall data would support that claim (unemployment is relatively low and consistent, new job creation, robust job openings, etc.). Yes, there are bright spots, but – at risk of sounding like the Grinch – the broader trend is cooling. Job openings are down nearly 1M, and monthly hires have fallen ~500k over the past year. In fact, the hire rate (which is the single most important/telling data point over the past 6-months) is comparable to 2013 levels. This is particularly concerning in the Professional and Business/Technology Services Sector. The hire rate for these sectors is comparable to levels not seen since the 2008-9 recession. Depending on the industry/sector in which you view the labor market (as a job seeker or company looking to hire), the temperature of the market likely feels very different. To help put this in perspective, the following graph highlights job decreases in many white-collar jobs since 2018:
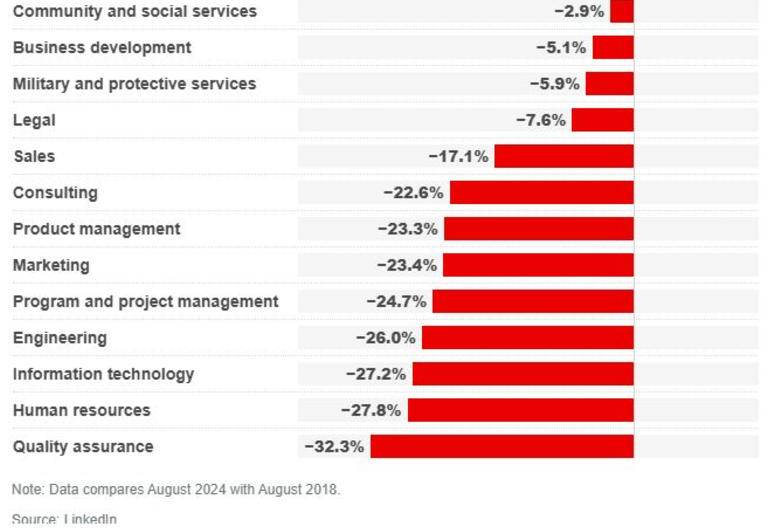
December – the month most known for predicting what will happen ”next year” (rumor is there’s also a few Holidays?!). I’ve played the prediction game in the past and have learned an important lesson – I’m terrible at predicting the future. I made the mistake of reviewing my predictions over the past few years and it’s not just that I often missed the mark, but the predictions we’re mostly useless – unemployment will rise (2023), tech hiring will slow (2022), remote hiring will plummet (2021). I am taking myself out of the prediction game.
This year, I’ll shift from predicting what will happen, to looking at some data and share what should happen. Here are some thoughts on two themes and how to respond.
Job Tenure – People are changing jobs at a rapid pace. Let’s look at the data:
- The average job tenure is just 3.9 years
- However, broken down by age group, it tells a more interesting story:
- The median tenure of workers ages 55 to 64 is 9.8 years
- The median tenure of workers ages 25 to 34 is only 2.8 years
- It’s a continual downward trend (it was 4.6 years 10-years ago); given the generational trends, the number will almost certainly continue to drop
Given this data, what should companies do? Create actionable and common-sense Internal Mobility Programs. Employees have a desire to change jobs – frequently. Given this fact, organizations should strongly consider implementing internal mobility programs that proactively provide employees with new/different opportunities in their organization. Mobility doesn’t have to be “upward”, lateral mobility often addresses the root problem. An important nuance – be proactive. Employment fluidity is part of our new reality; don’t be afraid to proactively recruit top performers to new jobs. Meaning, don’t wait for someone to express interest in moving. It’s counterintuitive, but you should proactively recruit your employees to other roles/teams. Yes, that means giving your internal recruiting team authority to recruit your own employees. What’s worse – losing your top performers to a new team, or losing them to a new company?
Employee Dissatisfaction – People are struggling, personally and professionally (this also has a direct correlation with Job Tenure). Let’s look at the data:
- According to a recent Gallup poll (graph below), just 50% of people feel they are thriving in their overall lives
- Notably, the number of people thriving is shrinking, and the number of people struggling is increasing
- Gallop also recently released a report (graph below) indicating that over 50% of all working employees are either directly, or indirectly considering changing jobs in 2025 (I think the number is closer to ~75%)
- Notably, the number of people who are extremely satisfied with their job is shrinking
Given this data, what should companies do? Be human. Be kind. Genuinely care. It seems so simple, but it’s shocking to see how many people/companies miss the mark. It’s not just the right thing to do on the human level, there is a business case for being…well, nice. Check in with your employees, and whenever possible, provide flexible work arrangements that support their work/life needs. Being nice doesn’t mean being void of conflict, nor does it mean you can’t hold people accountable. However, leaders/companies that are unapologetically intolerant of assholes will perform better (revenue, profits, turnover, etc.).


By the Numbers:
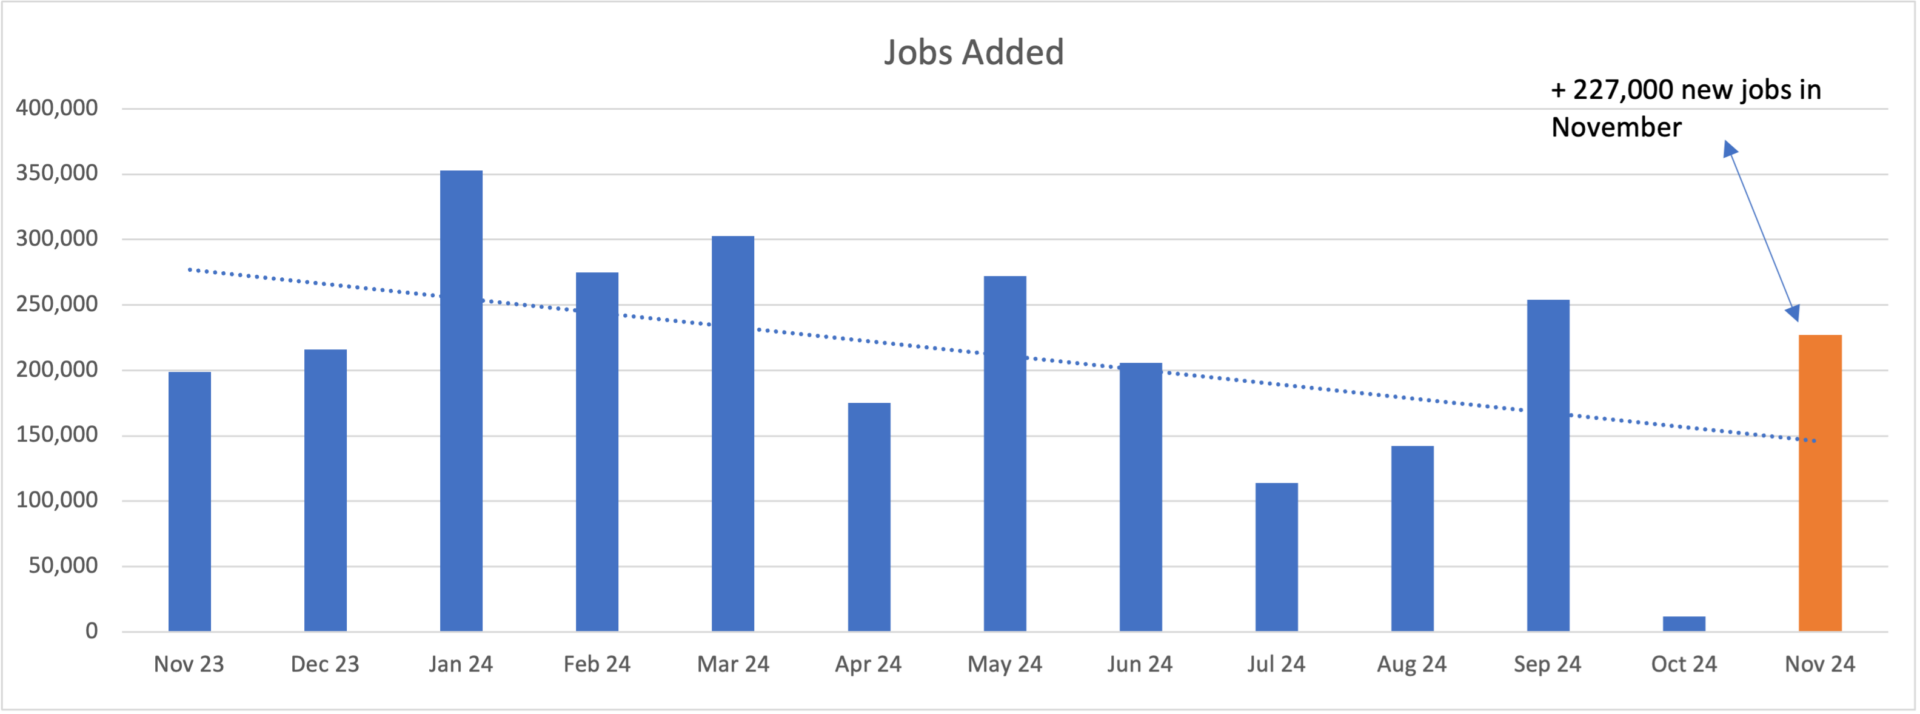
- New Jobs – the U.S. added 227,000 new jobs, a massive (albeit unsurprising) jump from last months addition of 12,000 new jobs created
- The US has added an average of 180,363 jobs per month in 2024
- The Education and Health sector led the advance with 79k new jobs created
- Unemployment ticked up slightly, rising from 4.1 to 4.2%
- The first time since 2021 that it has been at or above 4% for six consecutive months
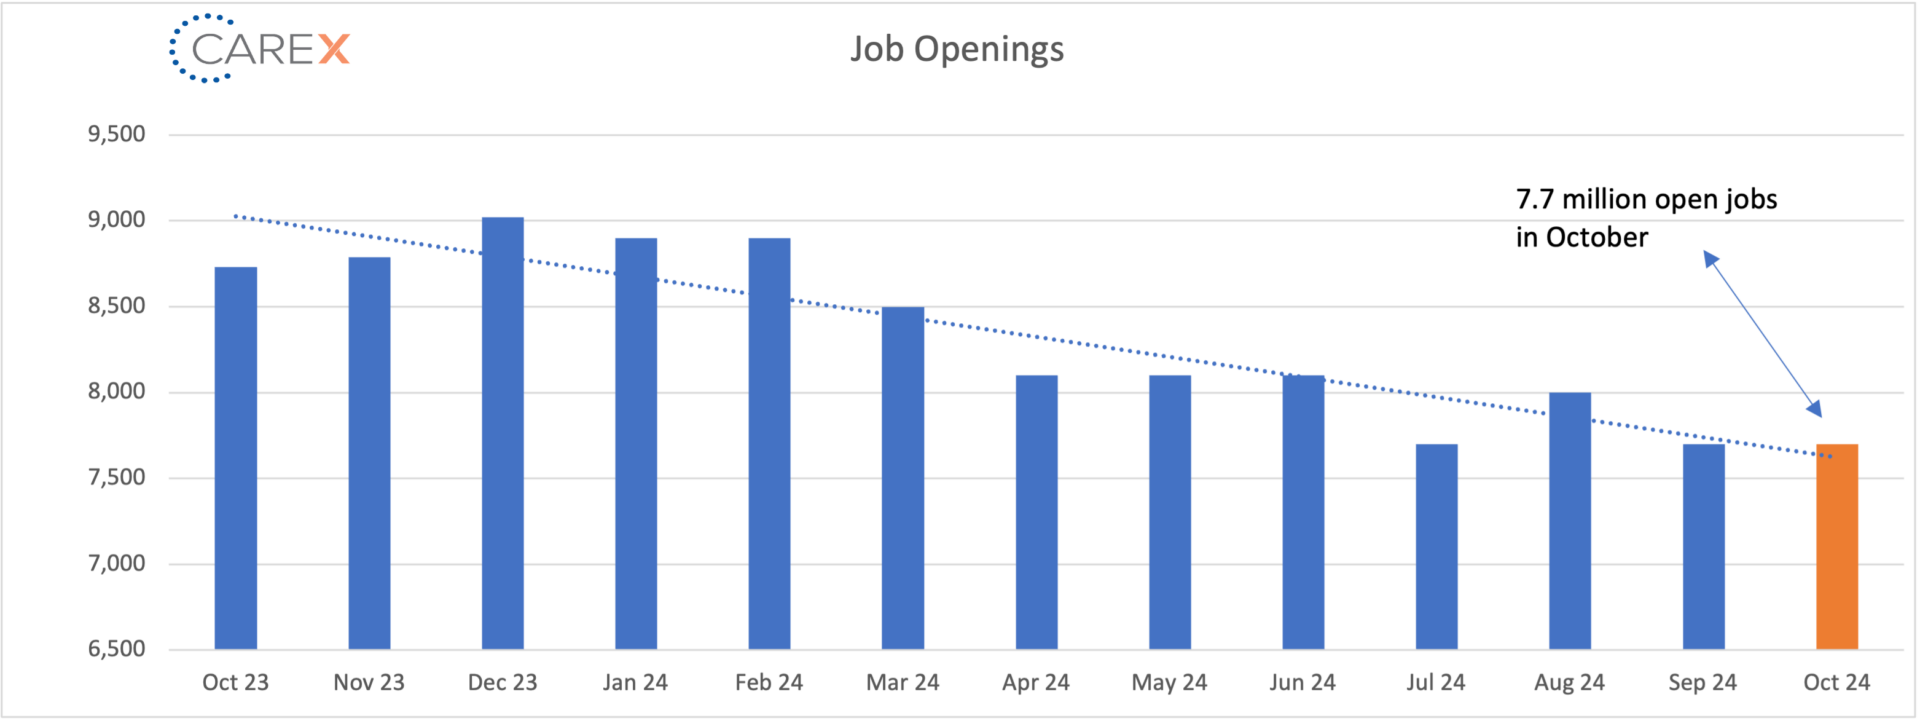
- Job openings held steady at 7.7 million, down from 8 million two months ago
- The lowest level in nearly 4 years
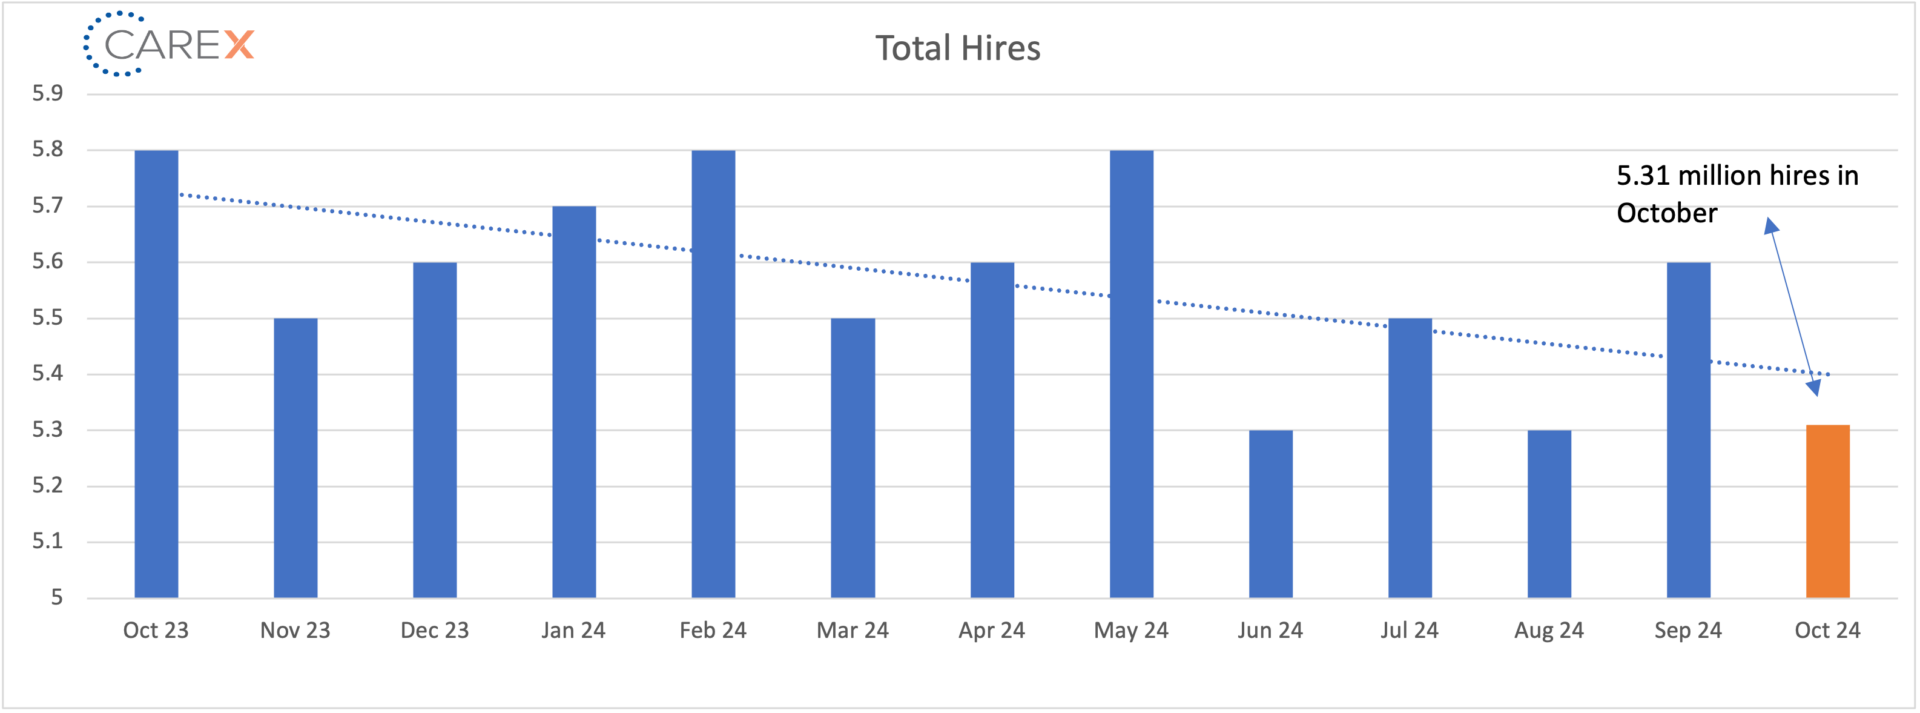
- Hires fell to 5.31 million, down from 5.6 million the previous month
- Down from 6~ million this time last year
- Layoffs decreased to 1.6 million, down from 1.8 million the previous month
- The layoff rate has stayed at ~1% for 13th consecutive months
- The number of layoffs remain very low by historical standards
- Quits increased for the second consecutive month, rising to 3.3 million, up from 3.1 million the previous month
- Quits, which are seen as a measure of worker confidence in the ability to change jobs and find another one continues to remain very steady – and very low
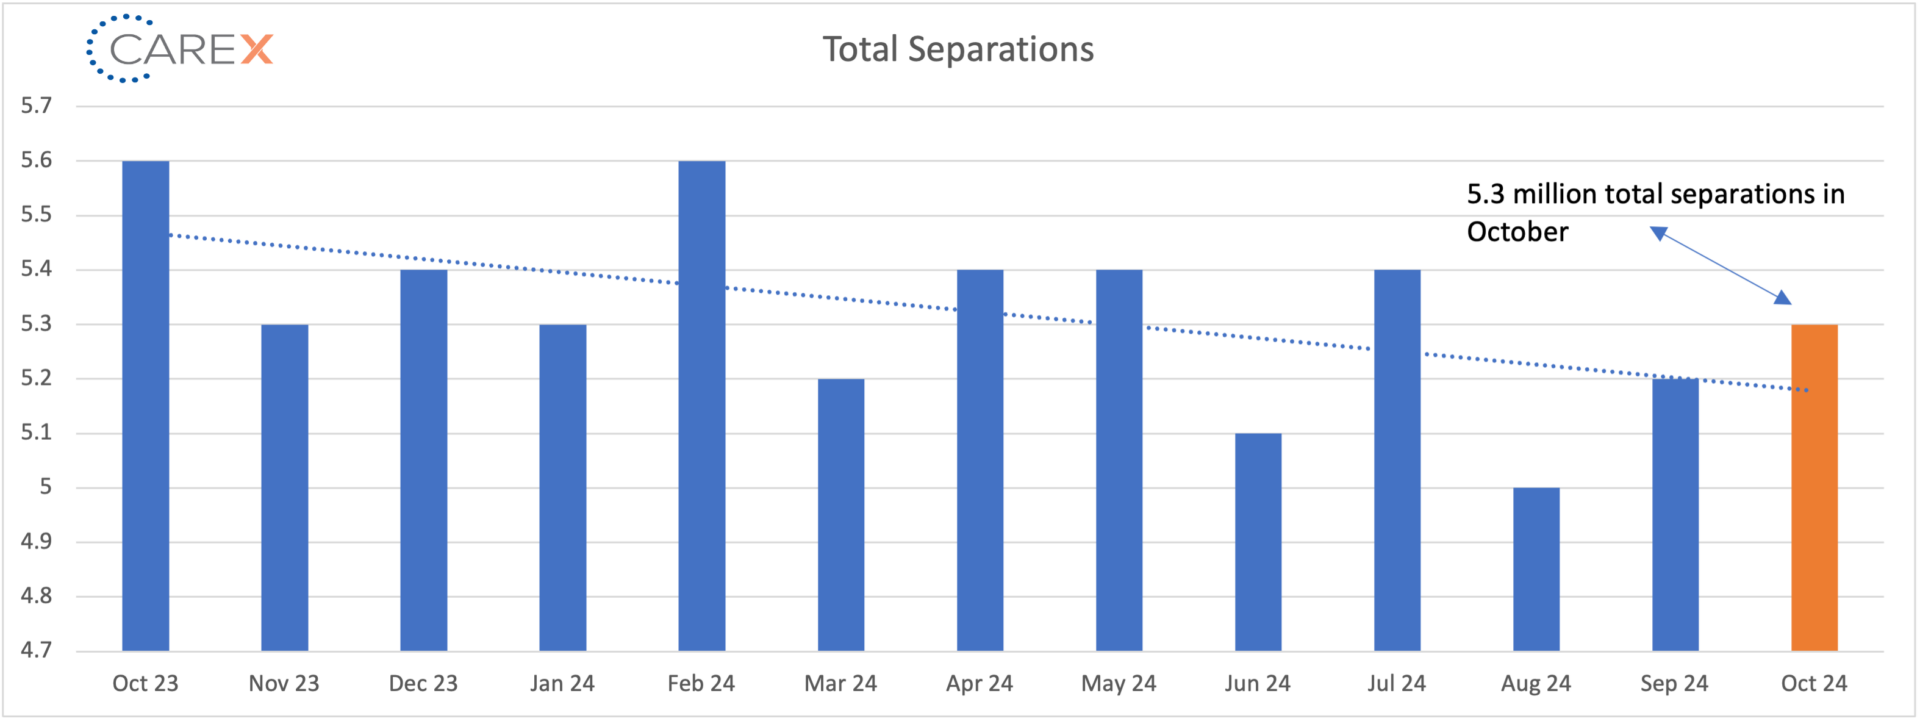
- Total separations increased slightly to 5.3 million, up from 5.2 million the previous month
- Overall, in 2024 separations have stabilized across all industries, notably the tech sector
- Jobs per available worker held steady for the second consecutive month at 1.1:1
- Noticeably down from 1.8:1 this time last year
- This ratio averaged ~2:1 over the past 2 years
- Labor Force Participation Rate (LFPR) fell for the second month in a row, dropping from 62.6% to 62.5%
- It hit a high of 67.3% in early 2000 and fell to 63.3% in the month before the onset of the pandemic
To make sure you never miss a Labor Market Insights update, you can subscribe to receive reminders via email here! While you’re here, make sure to check out the other resources we have available.


