New job reports were just released! Here’s our labor market insights for November 2024 written by Matt Duffy:
I spend a lot of time reviewing and trying to understand labor market data—admittedly, probably too much. I spend an equal amount of time considering how to deploy effective recruiting and talent strategies given the shifting labor market trends.
When the BLS/Jolts report is released, there are times I feel like Matt Damon in Good Will Hunting—where the numbers make sense, and a story emerges from the data. And there are times I feel like the Ben Affleck character—confused and feel like grabbing a beer and watching the Red Sox. This is a Ben Affleck kind of month. As much as I enjoy sifting through the data, this month’s report is unusually inconsequential. The data is incomplete or, at a minimum, complicated. Skewing the data is the effect of multiple hurricanes; large scale strikes (Boeing and others); and, because I’m cynical, the fact the data is being released just days before an election gives me pause (take my cynicism with a grain of salt, please). Based on the incomplete/inconsequential data, the analysis in the “By the numbers” section below was intentionally kept at a high level.
However, there’s one data point that’s close to telling a very consequential story. The author of this story is the quit rate. It’s a highly unsophisticated analysis, but one of the key drivers of our current low hire rate is the fact people aren’t quitting their jobs. When someone leaves their current role, it opens a slot for companies to hire for (often more than one). And unlike new or “float” jobs that remain open for months on end, a job opening because of a quit has a high likelihood of resulting in a hire. The quit rate just fell to 1.9%, below 2% for the 1st time since June 2020. The job quits rate in the United States averaged ~2% from 2000 until 2024, reaching an all-time high of 3% in November of 2021 (a record 4.5 million workers quit each month) and a record low of 1.2% in August of 2009 (the great recession).
So, why is the quit rate about to tell us a story? People aren’t quitting their jobs because everyone is content. To the contrary, depending on what survey you read, anywhere from 50-85% of workers plan on looking for and finding a new role. If this comes to fruition, the quit rate will increase which will result in a spike in hires. Of course, this is dependent on companies approving additional hires. However, data suggests companies plan on ramping up hiring in 2025. We’re coming out of the election cycle and large-scale recessionary concerns seem to be subsiding. How do you like them apples (sorry, last Good Will Hunting reference!)?
By the Numbers:
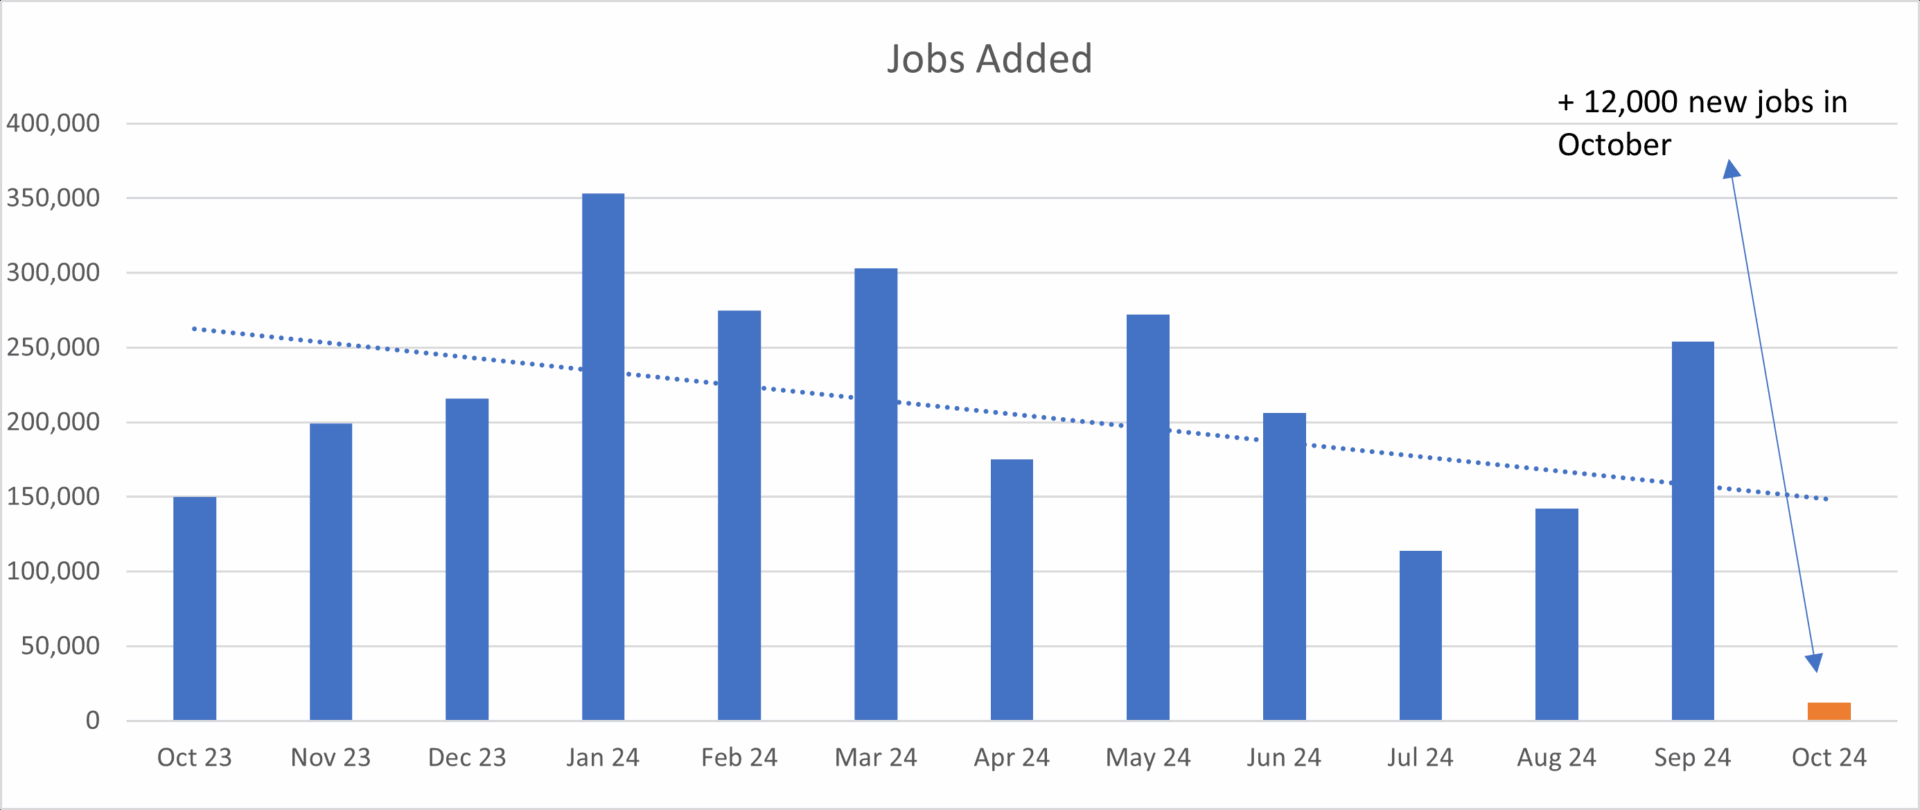
- New Jobs – the U.S. added 12,000 new jobs last month, the lowest single month gain since December 2020.
- This data must be taken with a grain of salt, as the hurricanes and Boeing strike (amongst others) significantly impacted the numbers (and ability to effectively capture the data).
- Unemployment remained unchanged at 4.1%.
- It was just 3.8% this time last year.
- There are ~ 1.2 million more unemployed people today compared to this time last year.
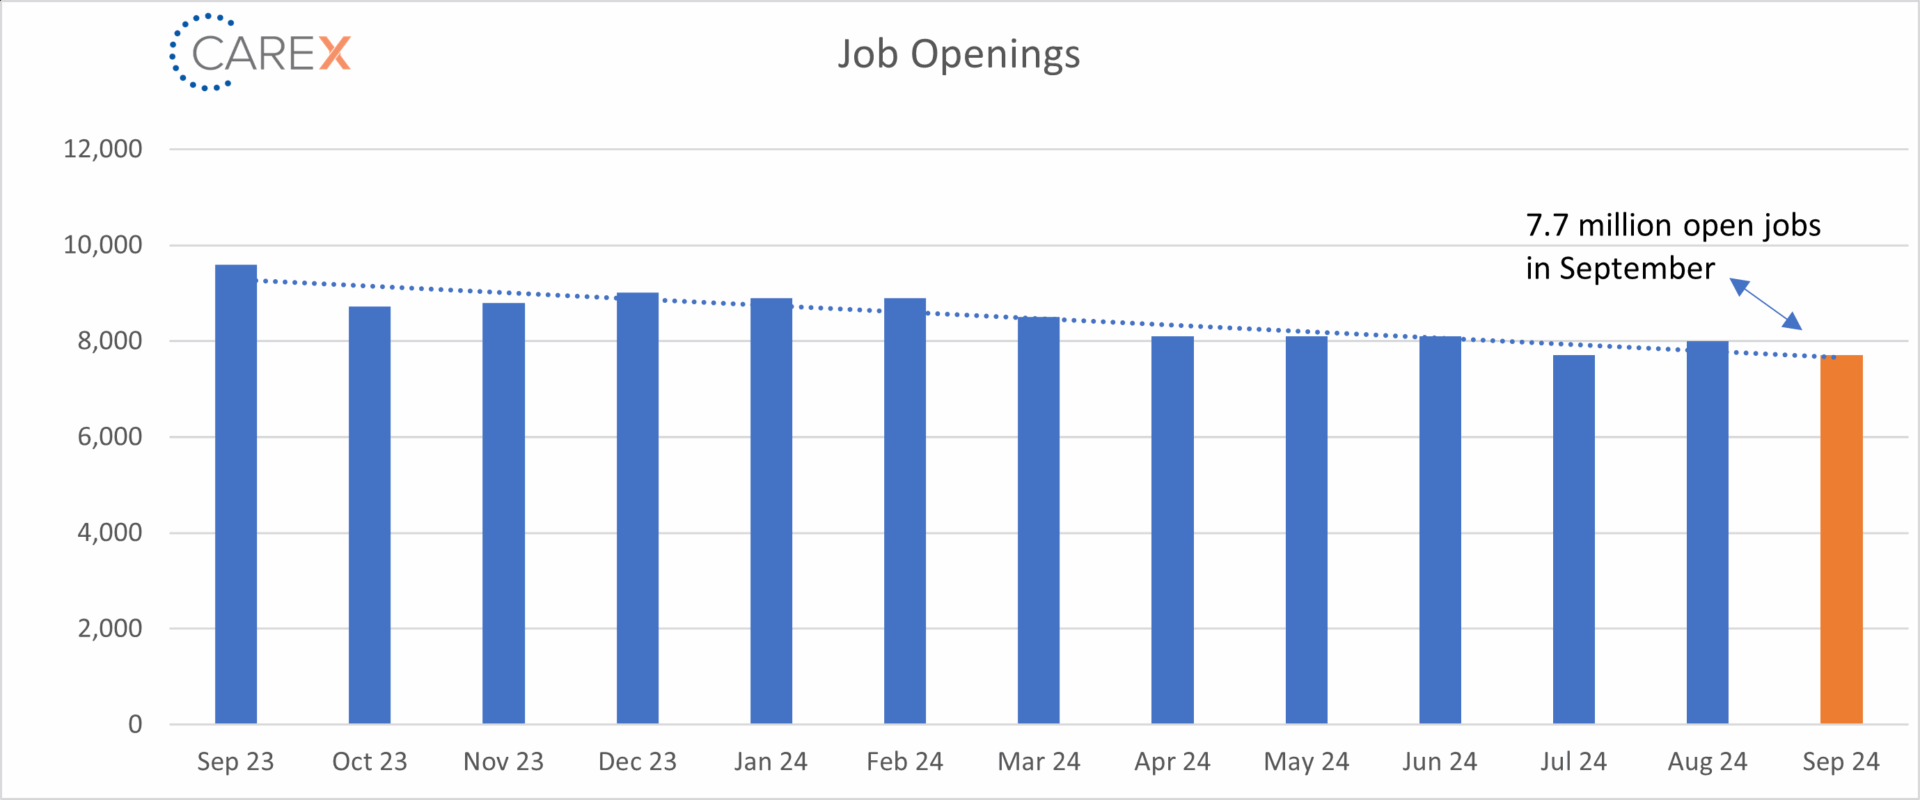
- Job openings dropped slightly to 7.7 million, down from 8 million the previous month.
- The lowest level in 3.5 years.
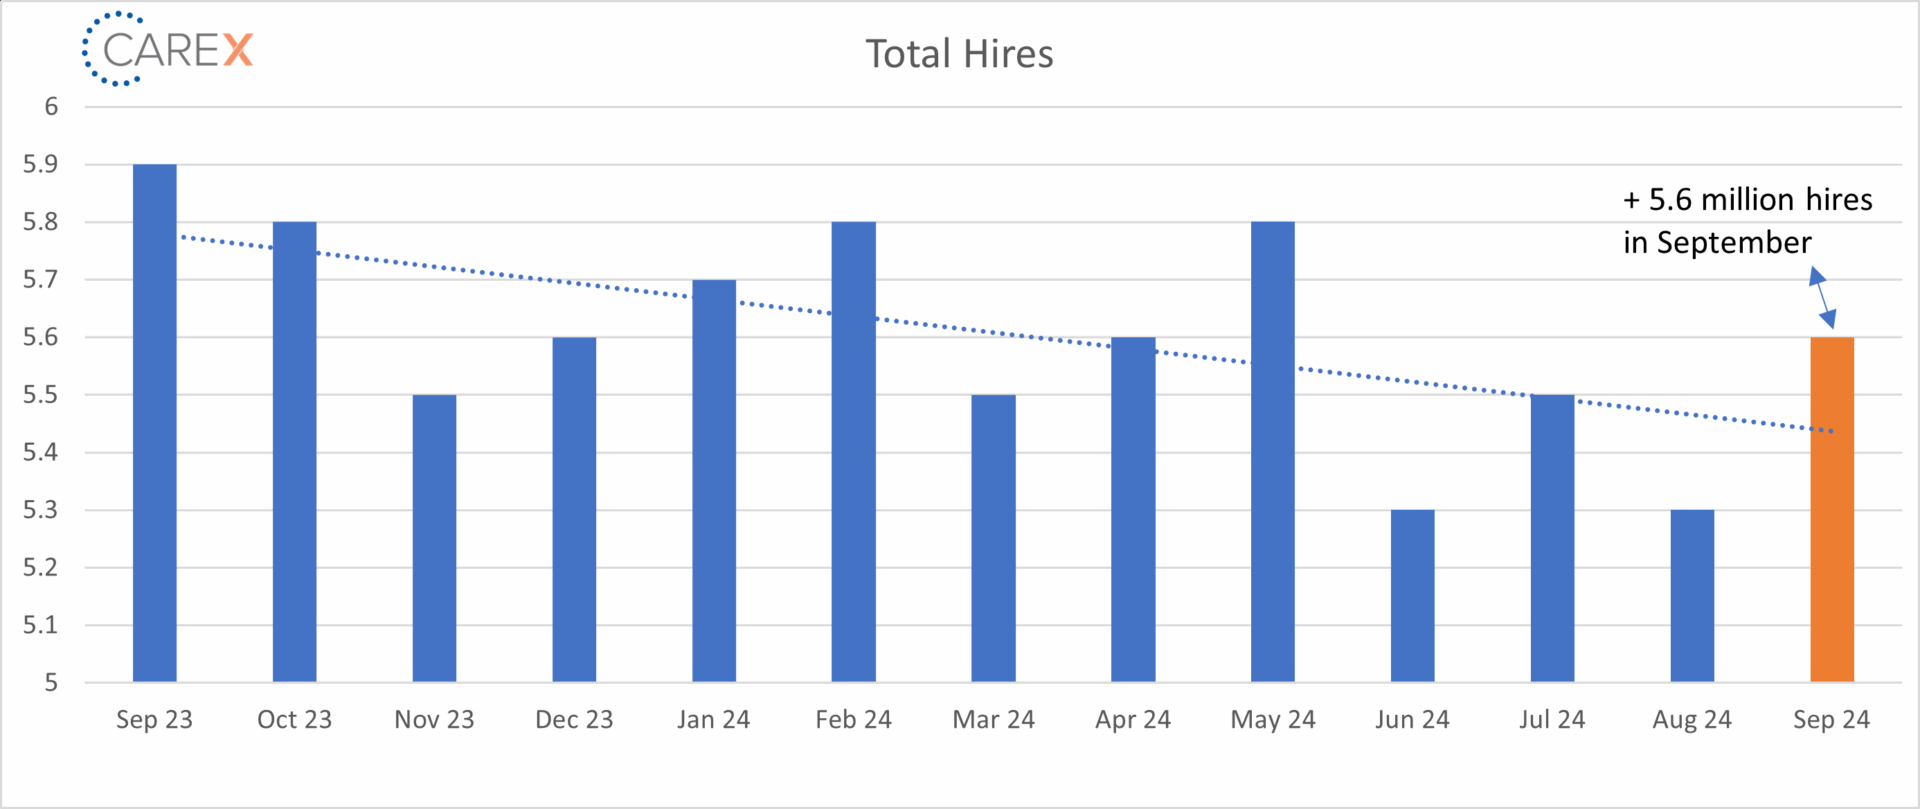
- Hires increased slightly to 5.6 million, up from 5.3 million the previous month.
- Down from 6.2 million this time last year.
- Layoffs increased slightly to 1.8 million, up from 1.6 million the previous month.
- The layoff rate has stayed at ~1% for 13 consecutive months.
- The number of layoffs remain very low by historical standards.
- Quits increased slightly to 3.1 million, up from 3 million the previous month.
- Quits, which are seen as a measure of worker confidence in the ability to change jobs and find another one, continues to remain very steady (and very low).
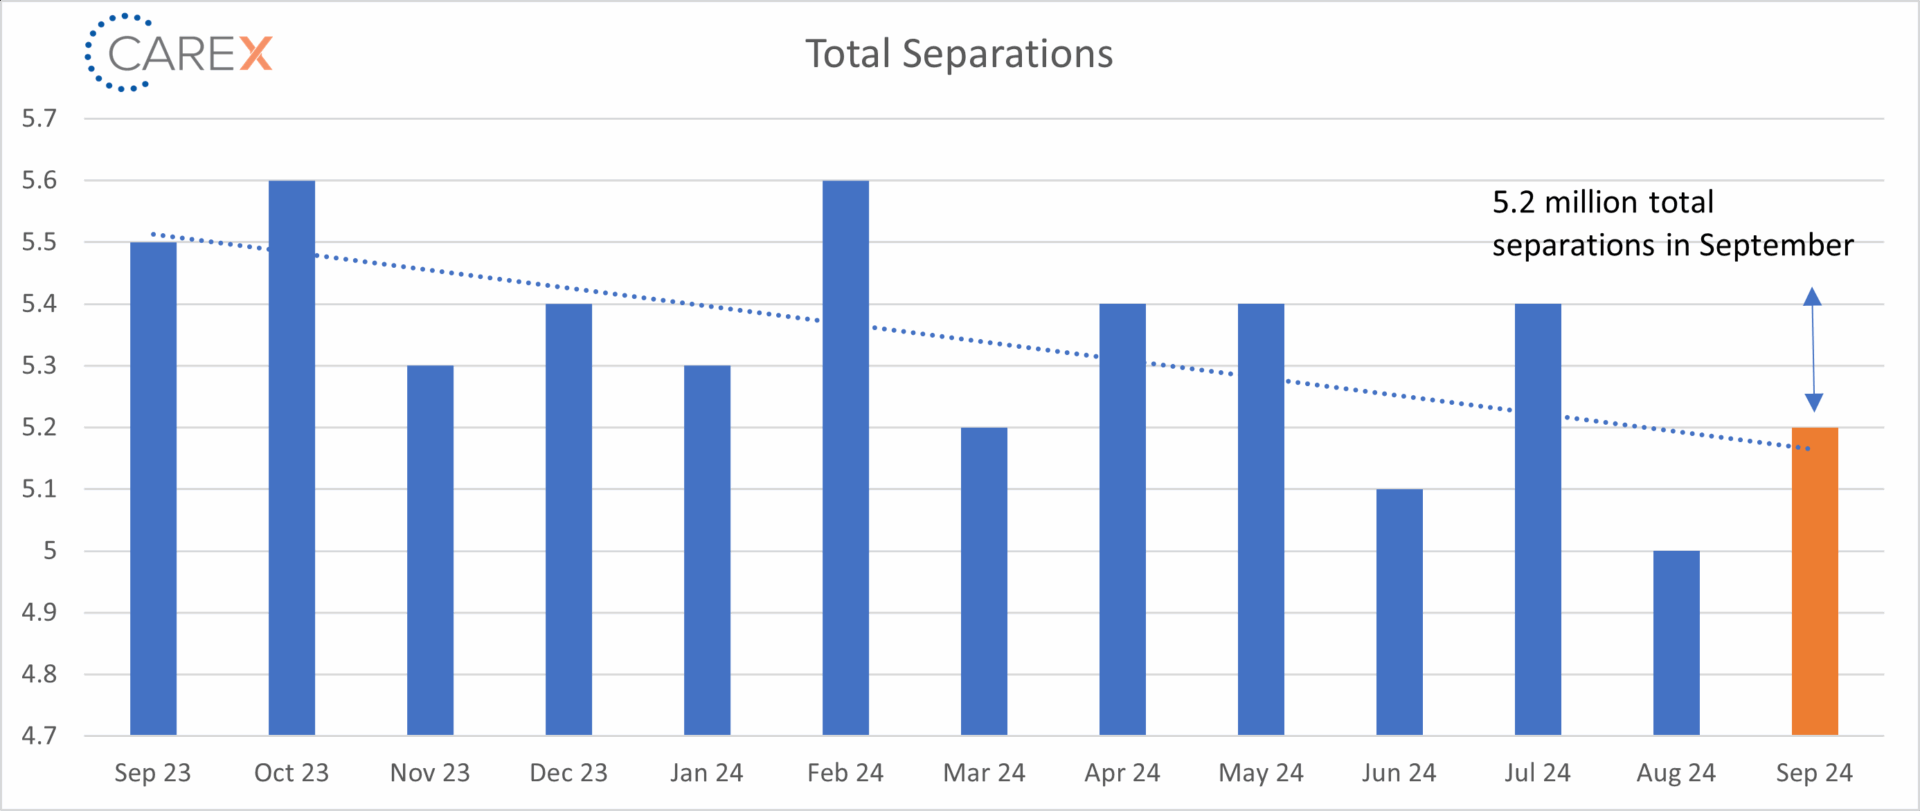
- Total separations increased slightly to 5.2 million, up from 5 million the previous month.
- Overall, in 2024 separations have stabilized across all industries, notably the tech sector.
- Jobs per available worker held at 1.1:1.
- Noticeably down from 1.8:1 this time last year.
- This ratio averaged ~2:1 over the past 2 years.
- Labor Force Participation Rate (LFPR) fell for the first time in several months, dropping to 62.6%.
- It hit a high of 67.3% in early 2000 and fell to 63.3% in the month before the onset of the pandemic.
To make sure you never miss a Labor Market Insights update, you can subscribe to receive reminders via email here! While you’re here, make sure to check out the other resources we have available.


