New job reports were just released! Here’s our labor market insights for October 2024 written by Matt Duffy:
While writing last month’s Labor Market Insights, my teenage daughter asked what I was working on. I was so proud – she actually showed interest in something I find interesting! With a big smile, I told her I’d send her my report. A few minutes later, she responded with – “TLDR.” Which I soon learned stands for “too long didn’t read.” To which I responded with – “TSNA” (too sassy no allowance). This month I’ll try to be less verbose.
Given the surprisingly strong jobs report, there are some headlines indicating an undercurrent of strength in the labor market. While I’m an optimist, I’m not quite in the “undercurrent of strength” camp. As I’ve said before, job openings are less predictive than other key data points (too volatile and prone to change) and taken on the surface may overstate how healthy the labor market is. Also, keep in mind job growth in 2024 has largely been centralized in just a few industries – health care, government, and construction; so, the strength in one industry isn’t reflective of overall labor market strength.
A summary of the key data points is listed below. Lumped together, they tell a numbingly boring story of consistent cooling.
So, the million-dollar question – how long until the labor market slides into a deep freeze or heats up? Like two boxers squaring off in the ring, there are two data points that are in a stare down and will determine the answer to this question – those data points are hires and layoffs. I’ve been keeping a close eye on these two points over the last several months. Both are in a precarious position – and the health of the labor market rests in their hands.
In one corner, we have the hires rate, which has dropped to just 3.3%, comparable to 2013 levels. Don’t be fooled by the new jobs and job openings numbers, both are meaningless if companies aren’t actually hiring people. The lack of hiring across nearly every sector is highly concerning. In the other corner, we have layoffs, which are notably below historical standards. The layoff rate has been at ~1% in 2024; well below the 2010’s average. If the layoff rate increased to an “average percentage,” the unemployment rate would be pushing 5% (at least).
The softening job market is moving beyond normalizing and moving into concerning territory. If the hiring rate ticks up, it’ll balance the waning numbers, and the market will start to thaw. However, if the hire rate stays flat and there’s an uptick in layoffs, we’ll see unemployment go the wrong direction and create an even more turbulent market.
There likely won’t be a knockout punch this year, but Q4 data should tell us who’s winning.
By the Numbers:
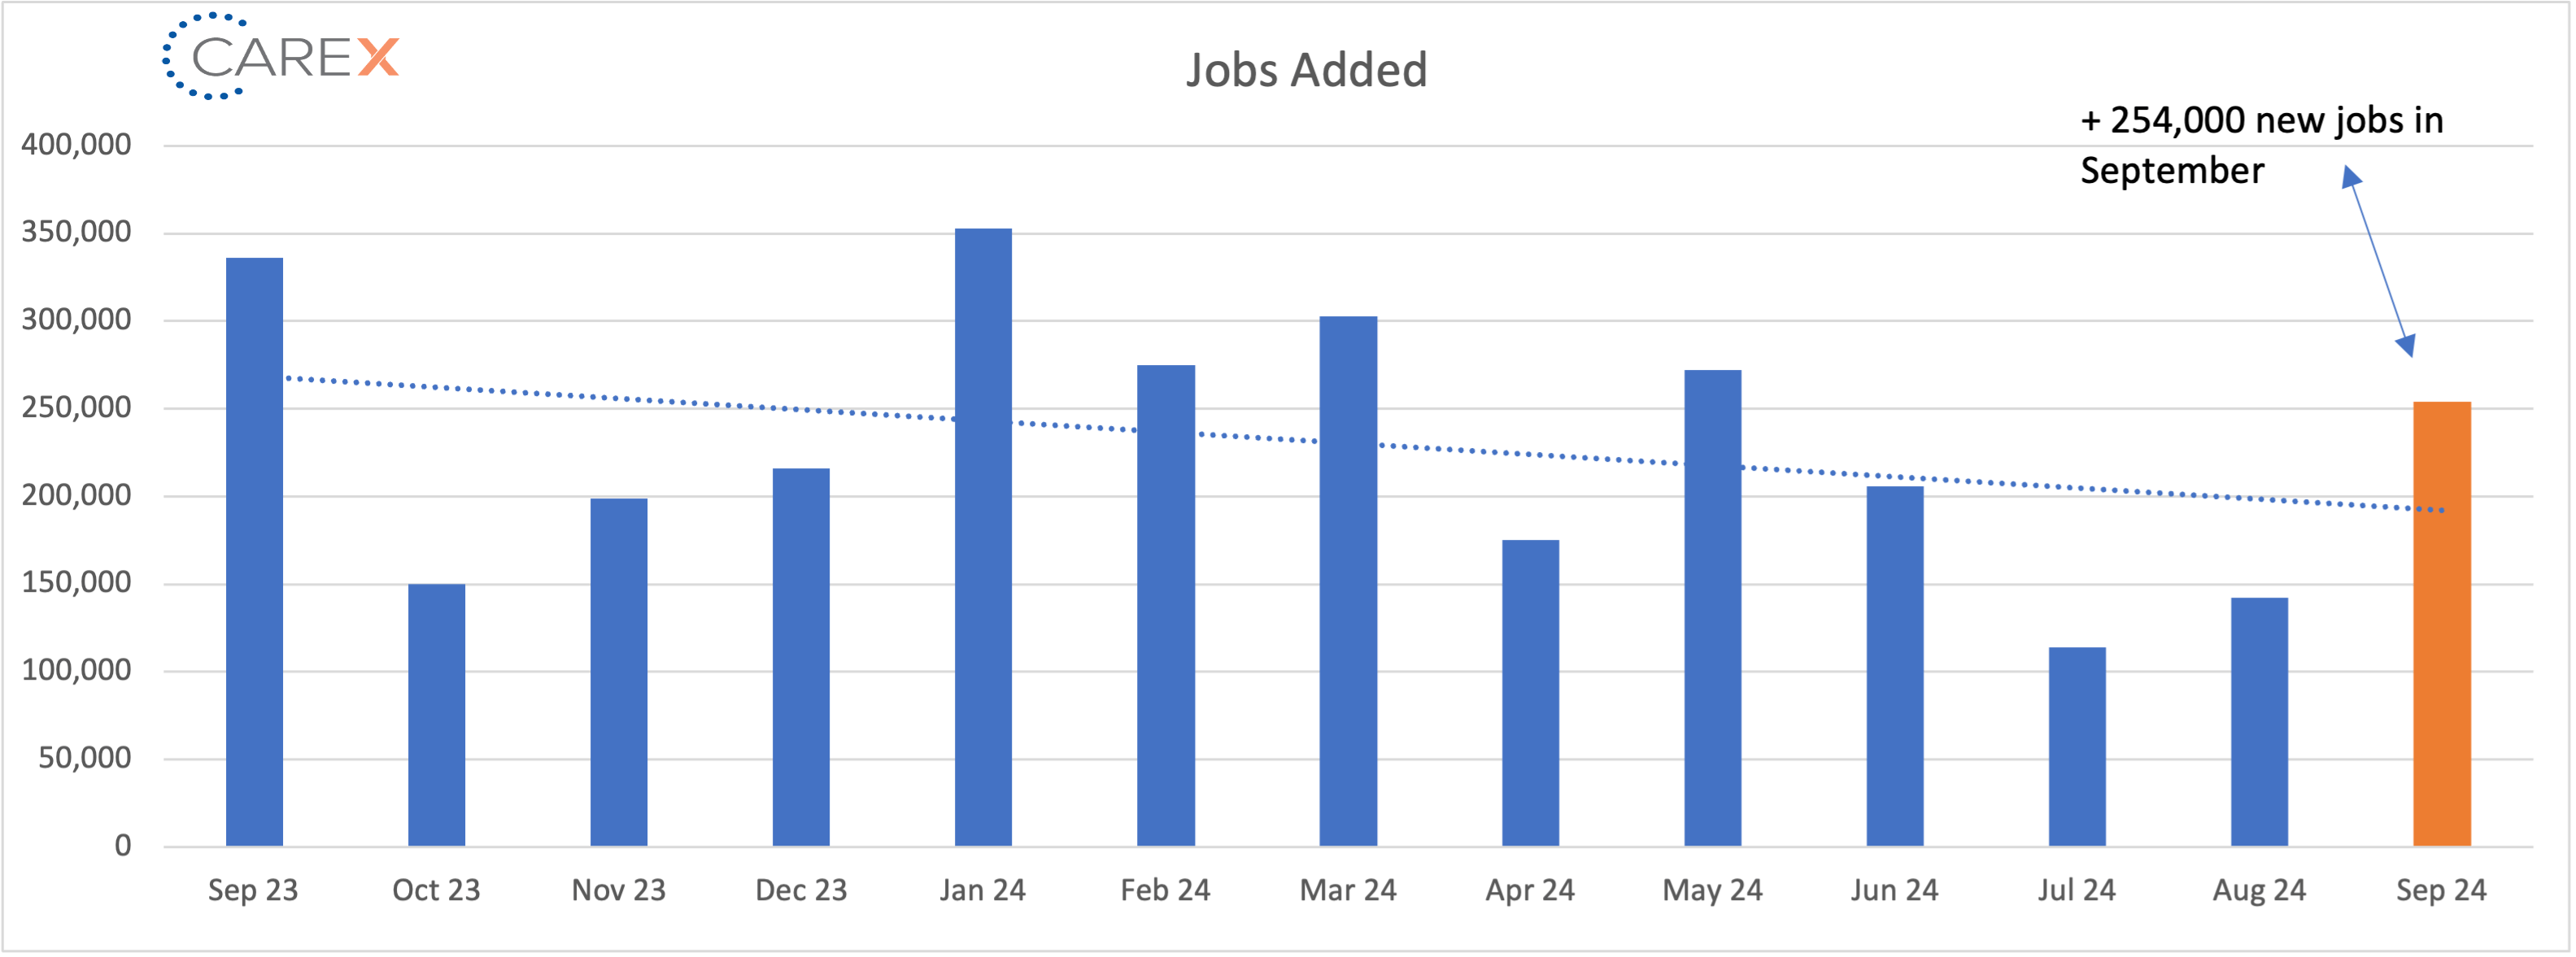
- New Jobs – the U.S. added 254,000 new jobs last month, crushing economists’ expectations.
- Once again, job growth is largely centralized in three industries – health care, government, and construction.
- Only two industries saw negative job growth – manufacturing and transportation/warehousing.
- Unemployment ticked down to 4.1%, down from 4.2% the previous month.
- This is the third month in a row that unemployment decreased.
- It was just 3.4% last spring.
- There are ~ 1.2 million more unemployed people today compared to this time last year.
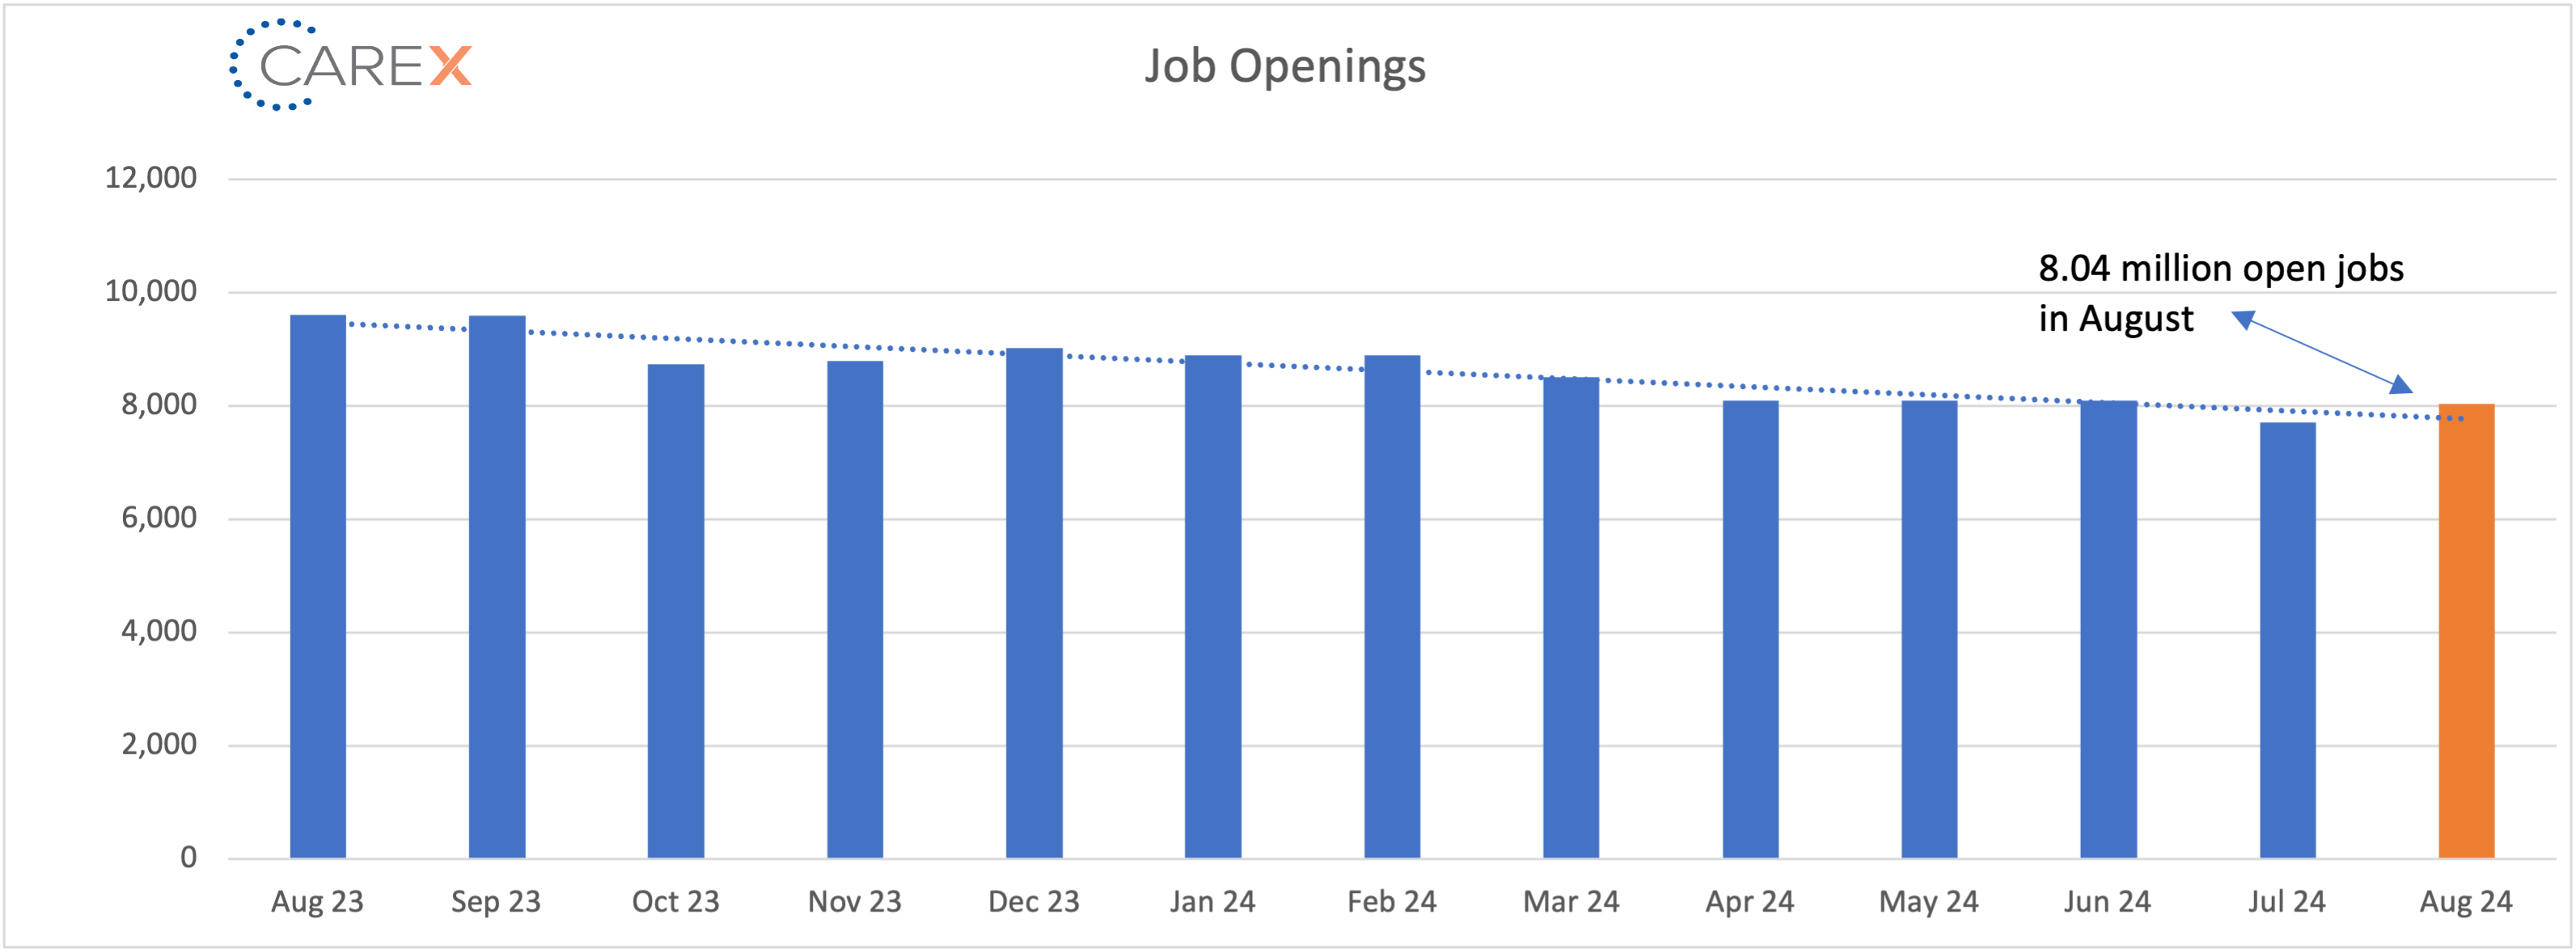
- Job openings jumped by ~330k, ticking up to 8.04 million, up from 7.7 million the previous month.
- Job openings increased in construction (+138,000) and in government (+78,000); job openings decreased in other services (-93,000).
- Medium-sized and large companies saw a notable decline in vacancies.
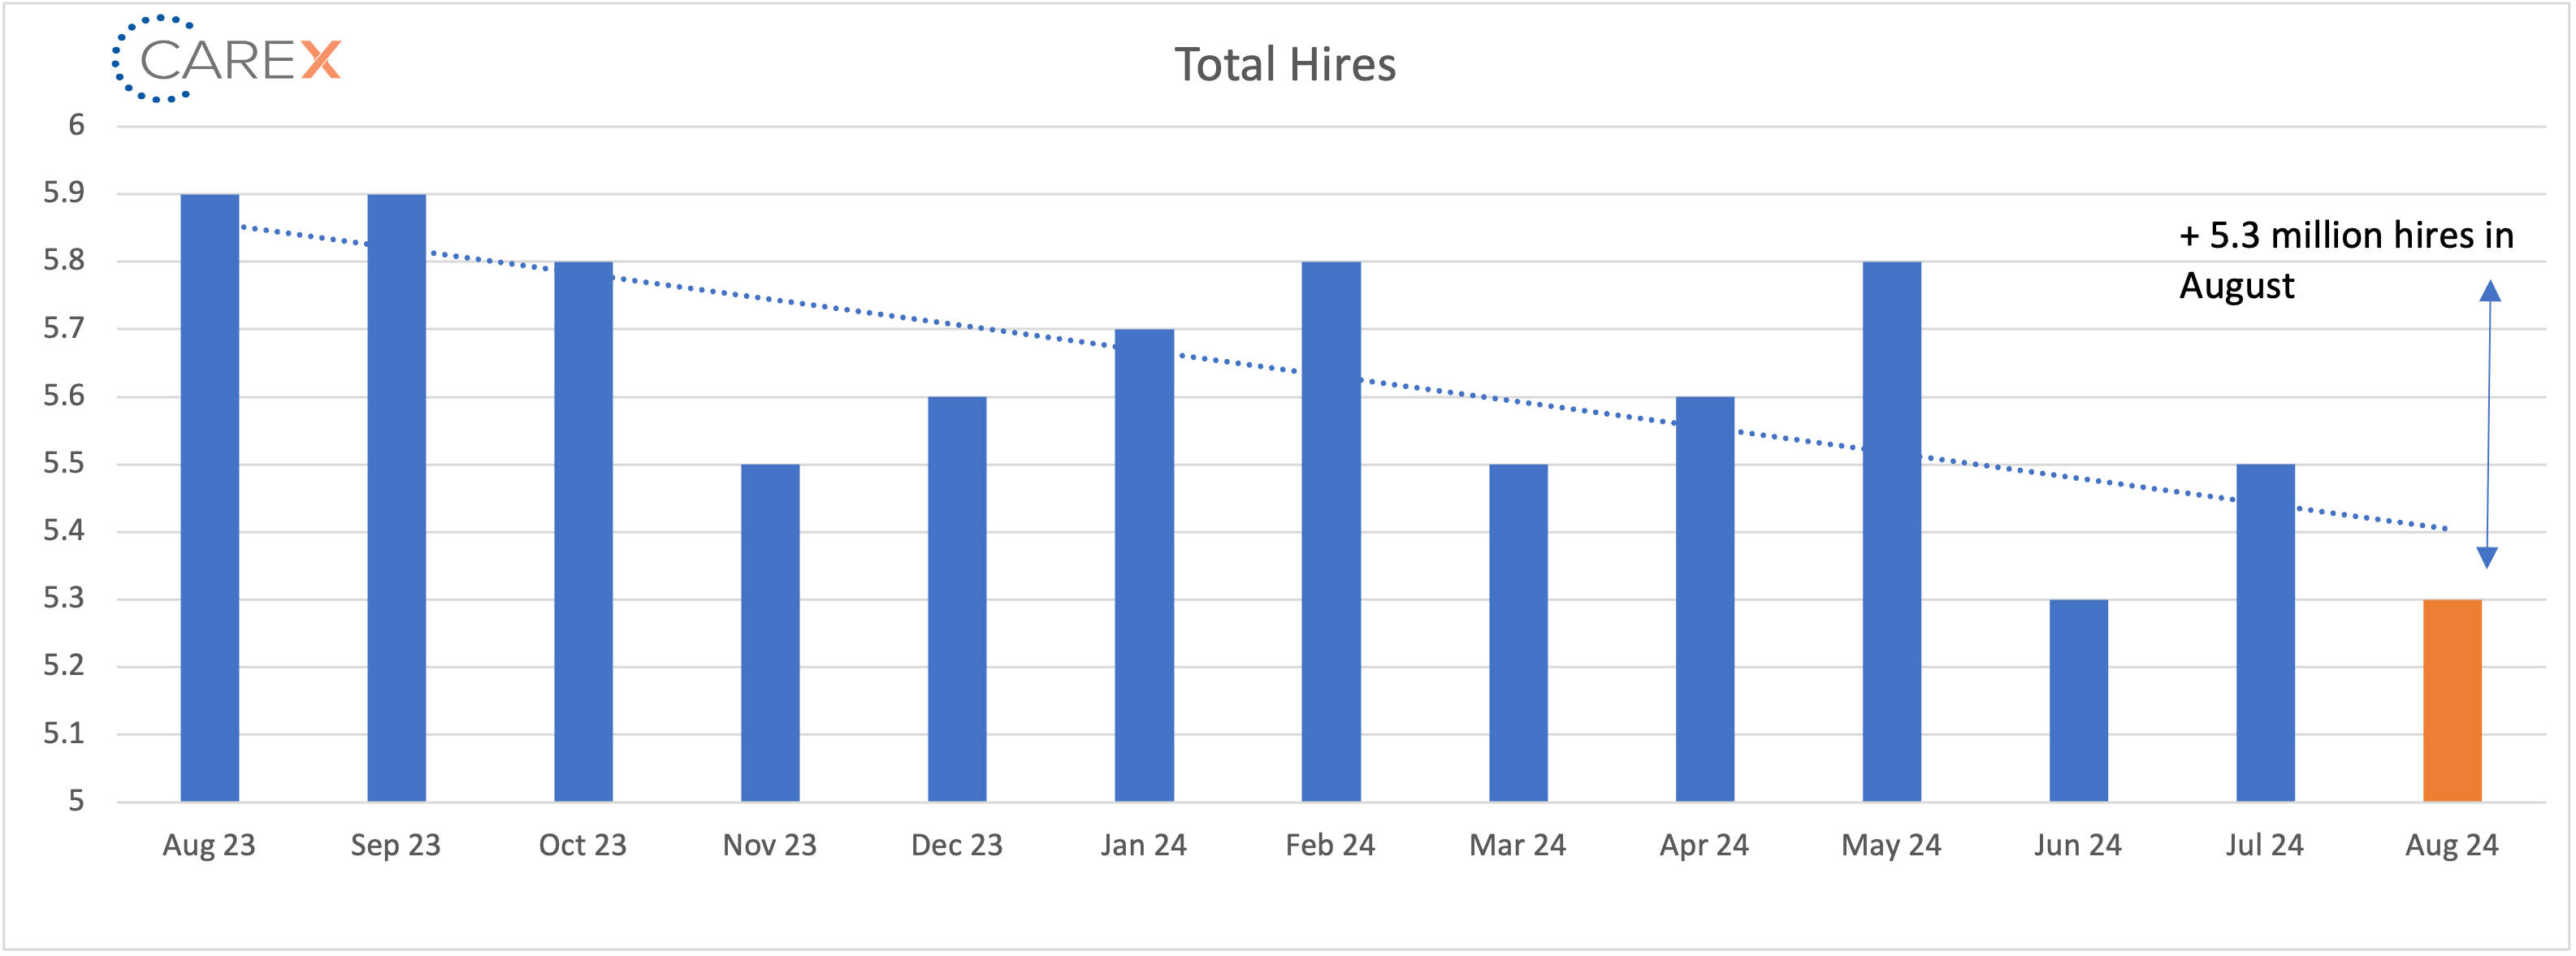
- Hires slipped 99,000, falling to 5.3 million, down from 5.5 million the previous month (and down from 5.8 million four months ago).
- Down from 6.2 million this time last year.
- Layoffs slipped to 1.6 million, down from 1.8 million the previous month.
- The layoff rate stayed at ~1% for the 12th consecutive month.
- The number of layoffs remain very low by historical standards.
- Quits dropped slightly to 3 million, down from 3.3 million the previous month.
- Quits, which are seen as a measure of worker confidence in the ability to change jobs and find another one continues to remain very steady (and very low).
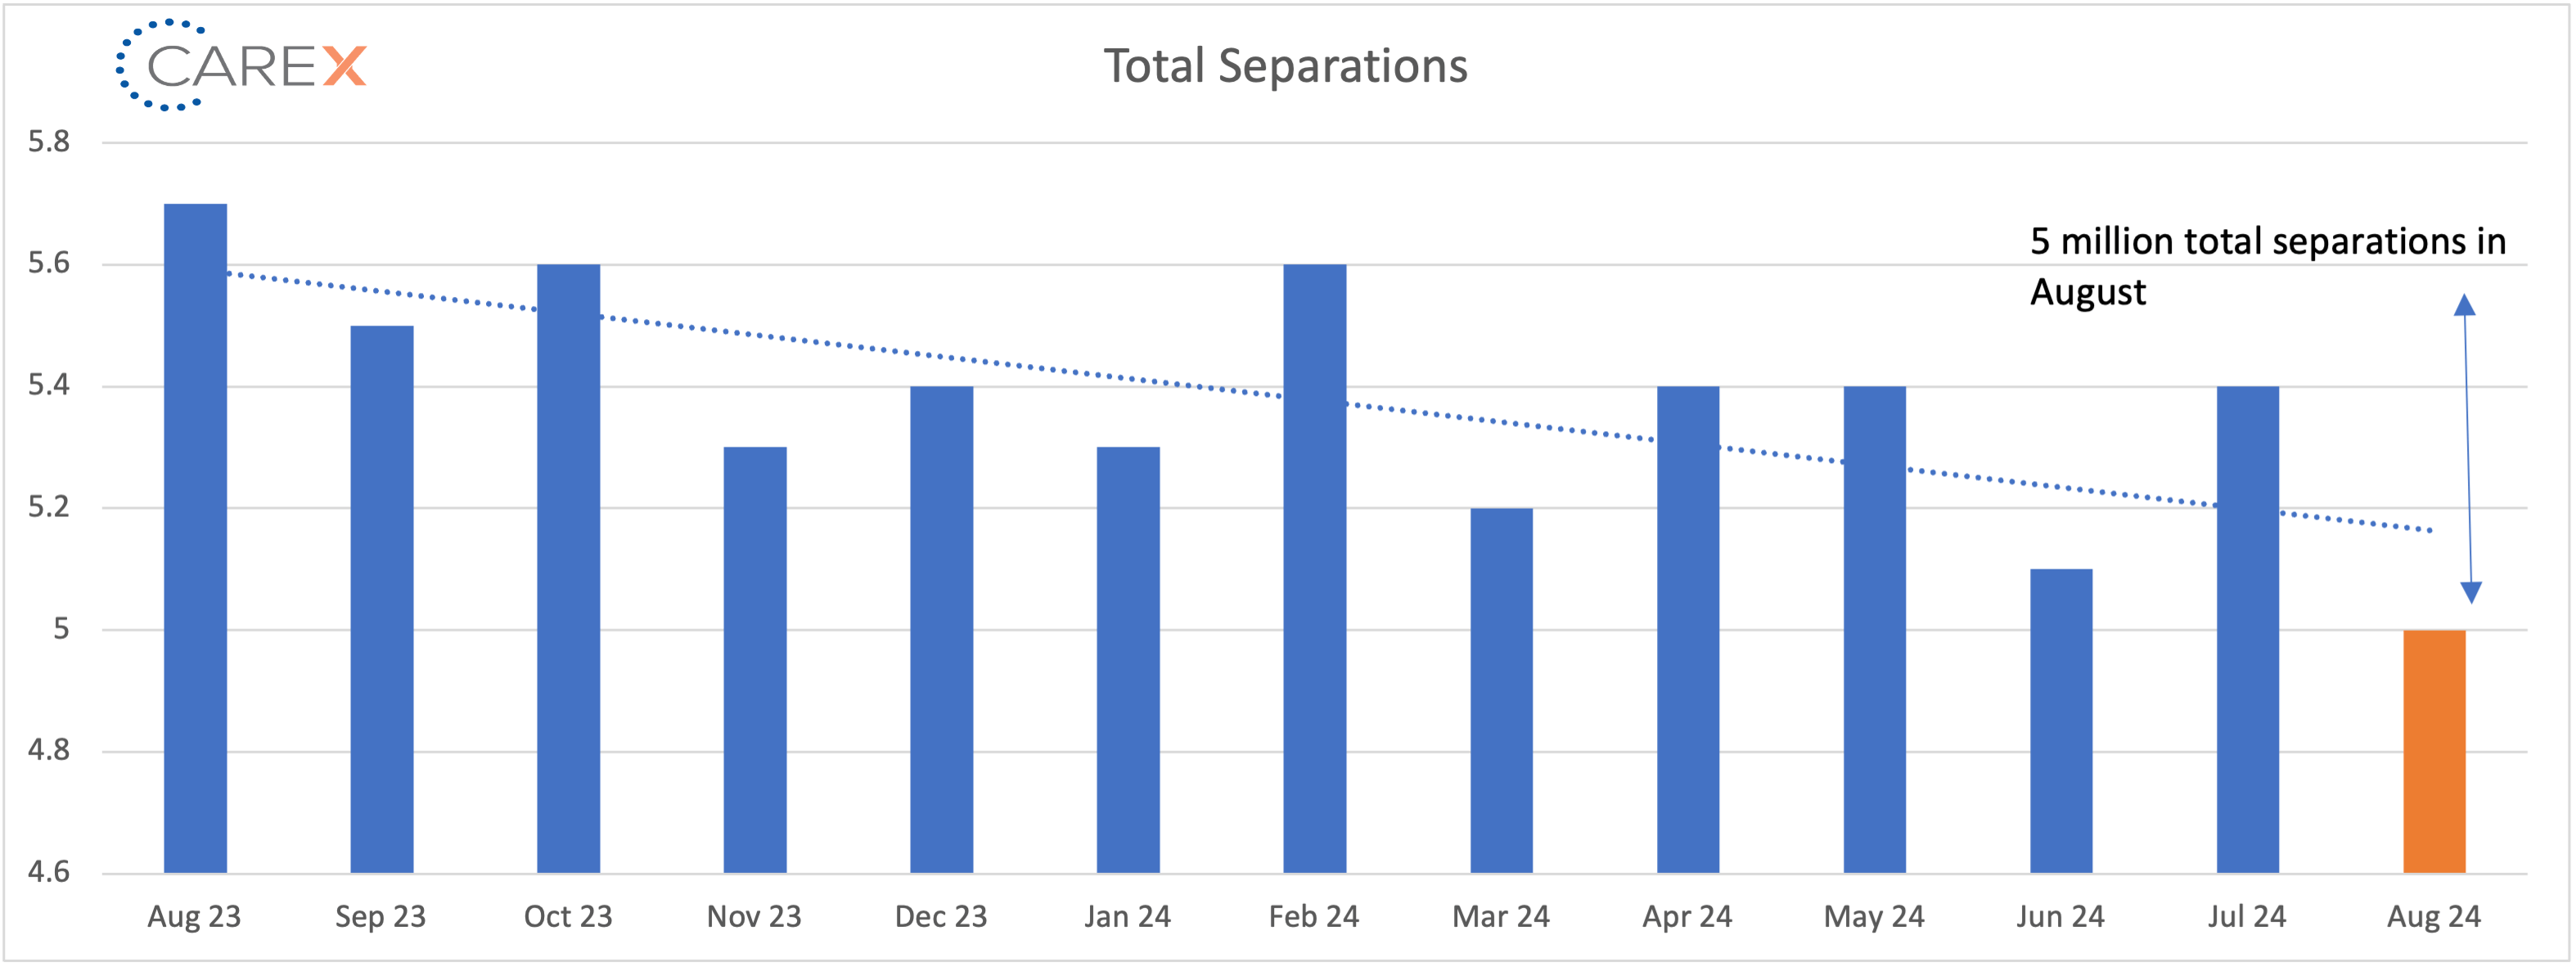
- Total separations dropped to 5 million, down from 5.4 million the previous month
- Total separations increased in professional and business services (+149,000) but decreased in accommodation and food services (-111,000) and in state and local government (-25,000).
- Overall, in 2024 separations have stabilized across all industries, notably the tech sector.
- Jobs per available worker held at 1.1:1.
- Noticeably down from 1.8:1 last summer.
- This ratio averaged ~2:1 over the past 2 years.
- Labor Force Participation Rate (LFPR) remained unchanged at 62.7%.
- It hit a high of 67.3% in early 2000 and fell to 63.3% in the month before the onset of the pandemic.
To make sure you never miss a Labor Market Insights update, you can subscribe to receive reminders via email here! While you’re here, make sure to check out the other resources we have available.


