The BLS and JOLTS report was just released! Here’s our labor market insights for September 2023.
Key Takeaways:
To understand the changing landscape of the labor market, it’s helpful to compare where we are today to where we were this time last year. Here are five indicators that help paint a picture:

Jobs added, openings, and hires are all notably lower. However, total separations and unemployment are relatively flat. Also, around this time last year, the Fed started to hatch a plan to put this trend in motion.
What do the Fed and Aaron Rodgers have in common? They both, in their own words, have told us to “R-E-L-A-X” (well, those were Rodgers’ words exactly). Relax, It’s all part of the plan. The plan: cool the labor market by limiting worker demand and controlling wage pressure. For now, their plan is working. However, the plan was to create slack in the labor market, not break it. Rodgers was correct when he told Packer fans to relax nearly a decade ago. Will the Fed have the same luck?
Key indicators (based on the above table) offer us hope, and I’m rooting for them…much more than I’m rooting for Rodgers this year (sorry Jets fans!). Making sense of the numbers can be difficult, but one thing is clear: companies are reducing their vacancies by pulling back on their job openings (hiring internally, closing open jobs before filling them, etc.) rather than increasing layoffs (which are very low by historical standards).
Nick Bunker, head of economic research at the Indeed Hiring Lab captured it correctly: “The U.S. labor market continues to come back to earth but from a very high peak, the labor market was sprinting last year and now it’s getting closer to a marathon pace. A slowdown is welcome; it’s the only way to go the distance.”

By the Numbers:
- New Jobs – The U.S. added 187,000 new jobs last month, mirroring the previous month’s gain (chart above).
- Small business continues to bolster the job count, counter-balancing large companies who controlled hiring this time last year.
- Unemployment rose to 3.8%, an increase from 3.5% the previous month.
- The highest it’s been since February 2022.
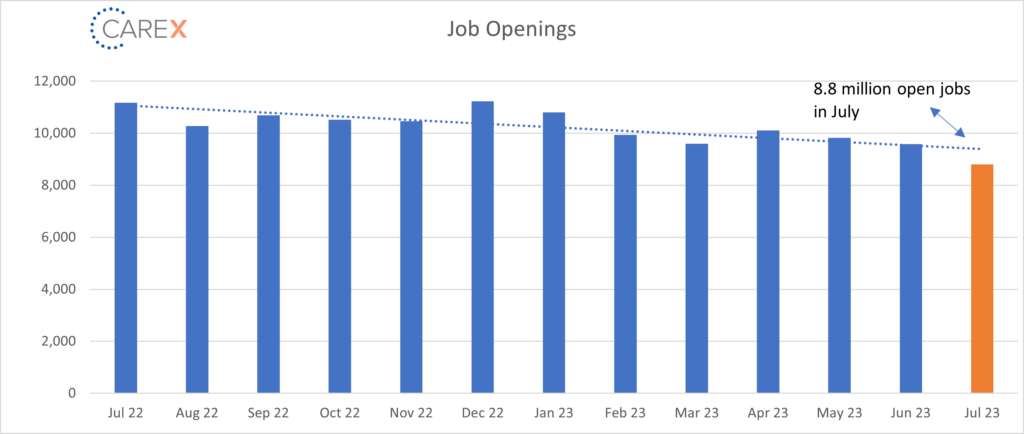
- Job openings fell to 8.82 million, a drop from 9.16 million the previous month (chart above).
- Well below the 9.46 million number that economists predicted.
- The decrease was led by the professional and business services sector, where job openings dropped 198,000.
- Dipping below 9 million for the first time since March of 2021 and nearly 3 million fewer jobs since the end of 2021.
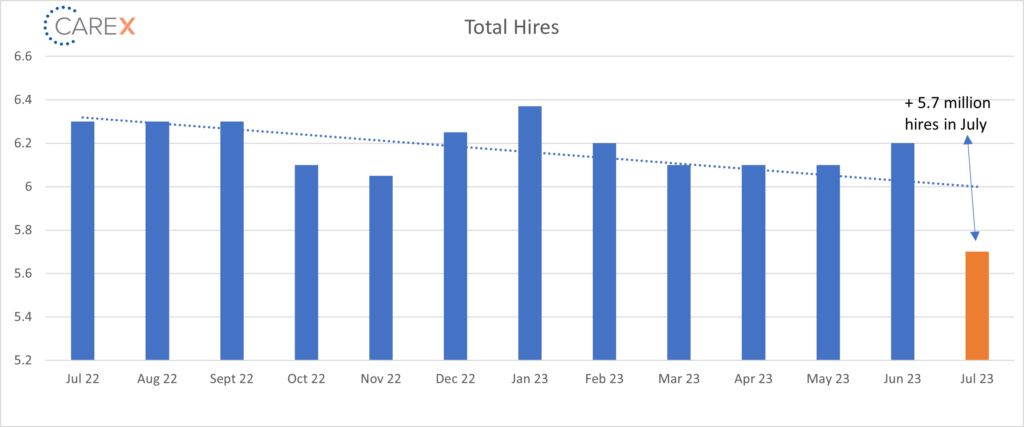
- Hires had a notable drop to 5.7 million, down from 6.2 million the previous month (chart above).
- The number of hires was consistent across all industries.
- Layoffs increased slightly to 1.6 million, an increase from 1.53 million the previous month.
- The number of layoffs is very low by historical standards.
- Quits – The number of people quitting their job dropped to 3.5 million, down from 3.8 million the previous month, and a decrease from 4 million two months ago.
- The quit level hasn’t been this low since early 2021.
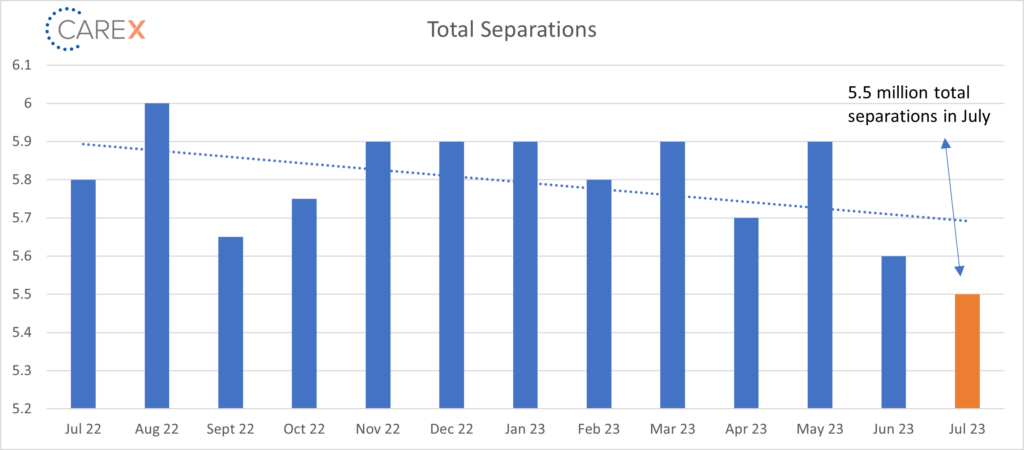
- Total separations remain largely steady at 5.5 million, down from 5.6 million, and a drop from 5.9 million two months ago (chart above).
- Jobs per available worker dropped to 1.5:1, down from 1.6:1 the previous month, and down from 1.8:1 three months ago.
- Five months ago, the ratio was 1.9:1 (and averaged ~2:1 over the past 2 years).
- Pre-pandemic this number was ~1.2:1.
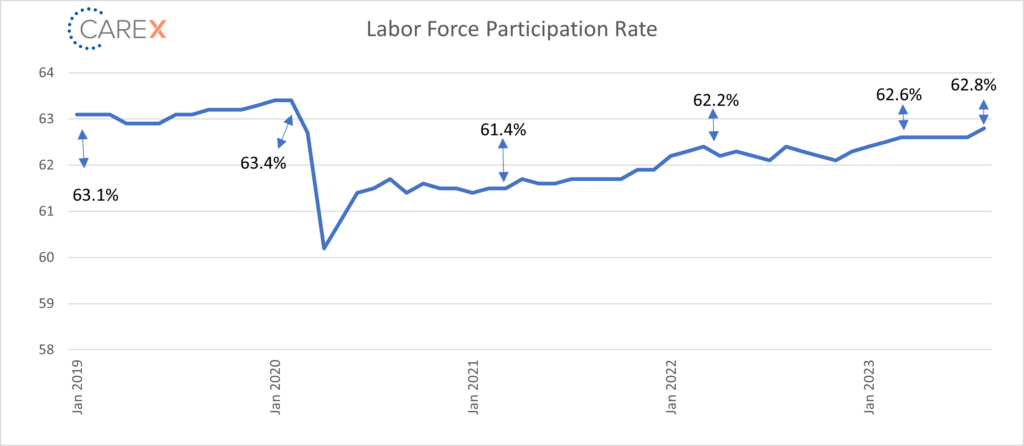
- Labor Force Participation Rate (LFPR) jumped to 62.8%, up from 62.6% the previous month.
- Notably, the number of working mothers is significantly higher than it’s ever been.
- 70.4% of women with children under 5 are in the workforce, compared to a peak of 68.9% before the pandemic.
To make sure you never miss a Labor Market Insights update, you can subscribe to receive these updates via email here! While you’re here, make sure to check out the other resources we have available.


