New job reports were just released! Here’s our labor market insights for September 2024.
Key Takeaways:
I don’t think we can discuss the labor market without addressing the recent news about the BLS job revisions. If you haven’t heard, last month the BLS announced that the labor market created 818,000 fewer jobs than previously reported, from March 2023 through March 2024. In summary, during that period:
- Total job creation decreased from 2.9 million to 2.1 million
- The monthly job creation average of 242k was in fact 175k new jobs added per month
What’s my take? Meh, not a big deal.
There’s an old (and immature) question – what’s more important, looks or personality? In this scenario, new job creation is the looks. While it’s what you might notice first, it’s what matters least. If you want to gauge the temperature of the labor market, look at its personality – specifically, unemployment, hires, terminations, and job openings.
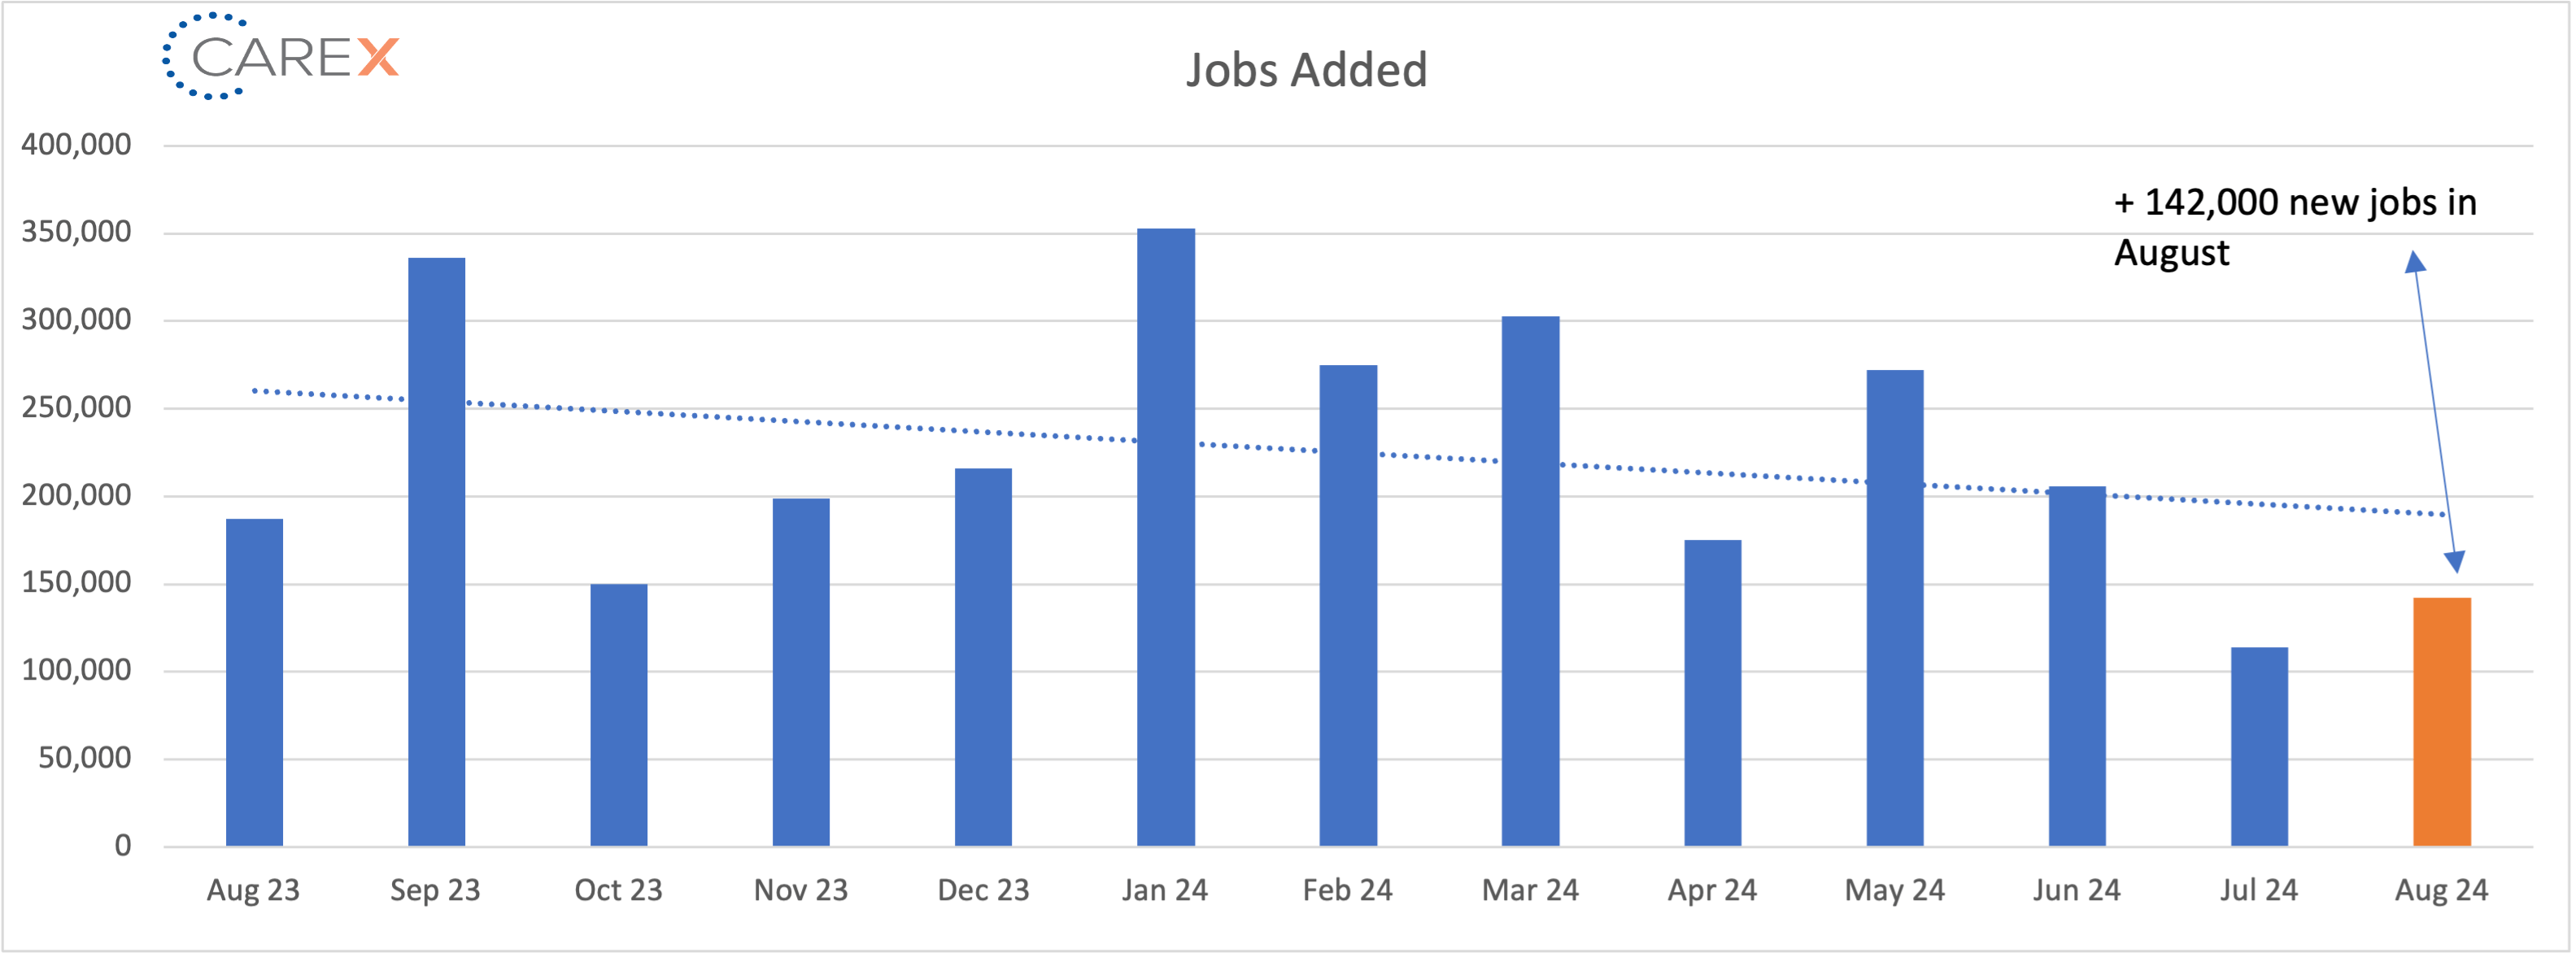
While politicians and media pundits jump on this number every month, it’s not the labor markets true north. I’m not saying it doesn’t matter – of course it does. However, keep in mind that new job creation doesn’t move the needle on the labor markets personality (or it’s critical indicators – unemployment, hires, terminations, and job openings). It does impact “totals jobs”, but on a monthly basis, it barely moves the needle. To help put this in perspective; despite the eye-catching number of hundreds-of-thousands of jobs added, the number for August represents 1.8% of the total jobs open in July. That’s a drop in the bucket and a poor characterization of the entire market.
First, let’s start by embracing the suck. The labor market is not good. In fact, I think it may be slightly worse than the data suggests. For those of us impacted by the labor market (hiring employees, retaining employees, job seekers, etc.), the metrics that matter most are lagging the most. Unemployment, hires, job openings (and yes, job creation) are going in the wrong direction.
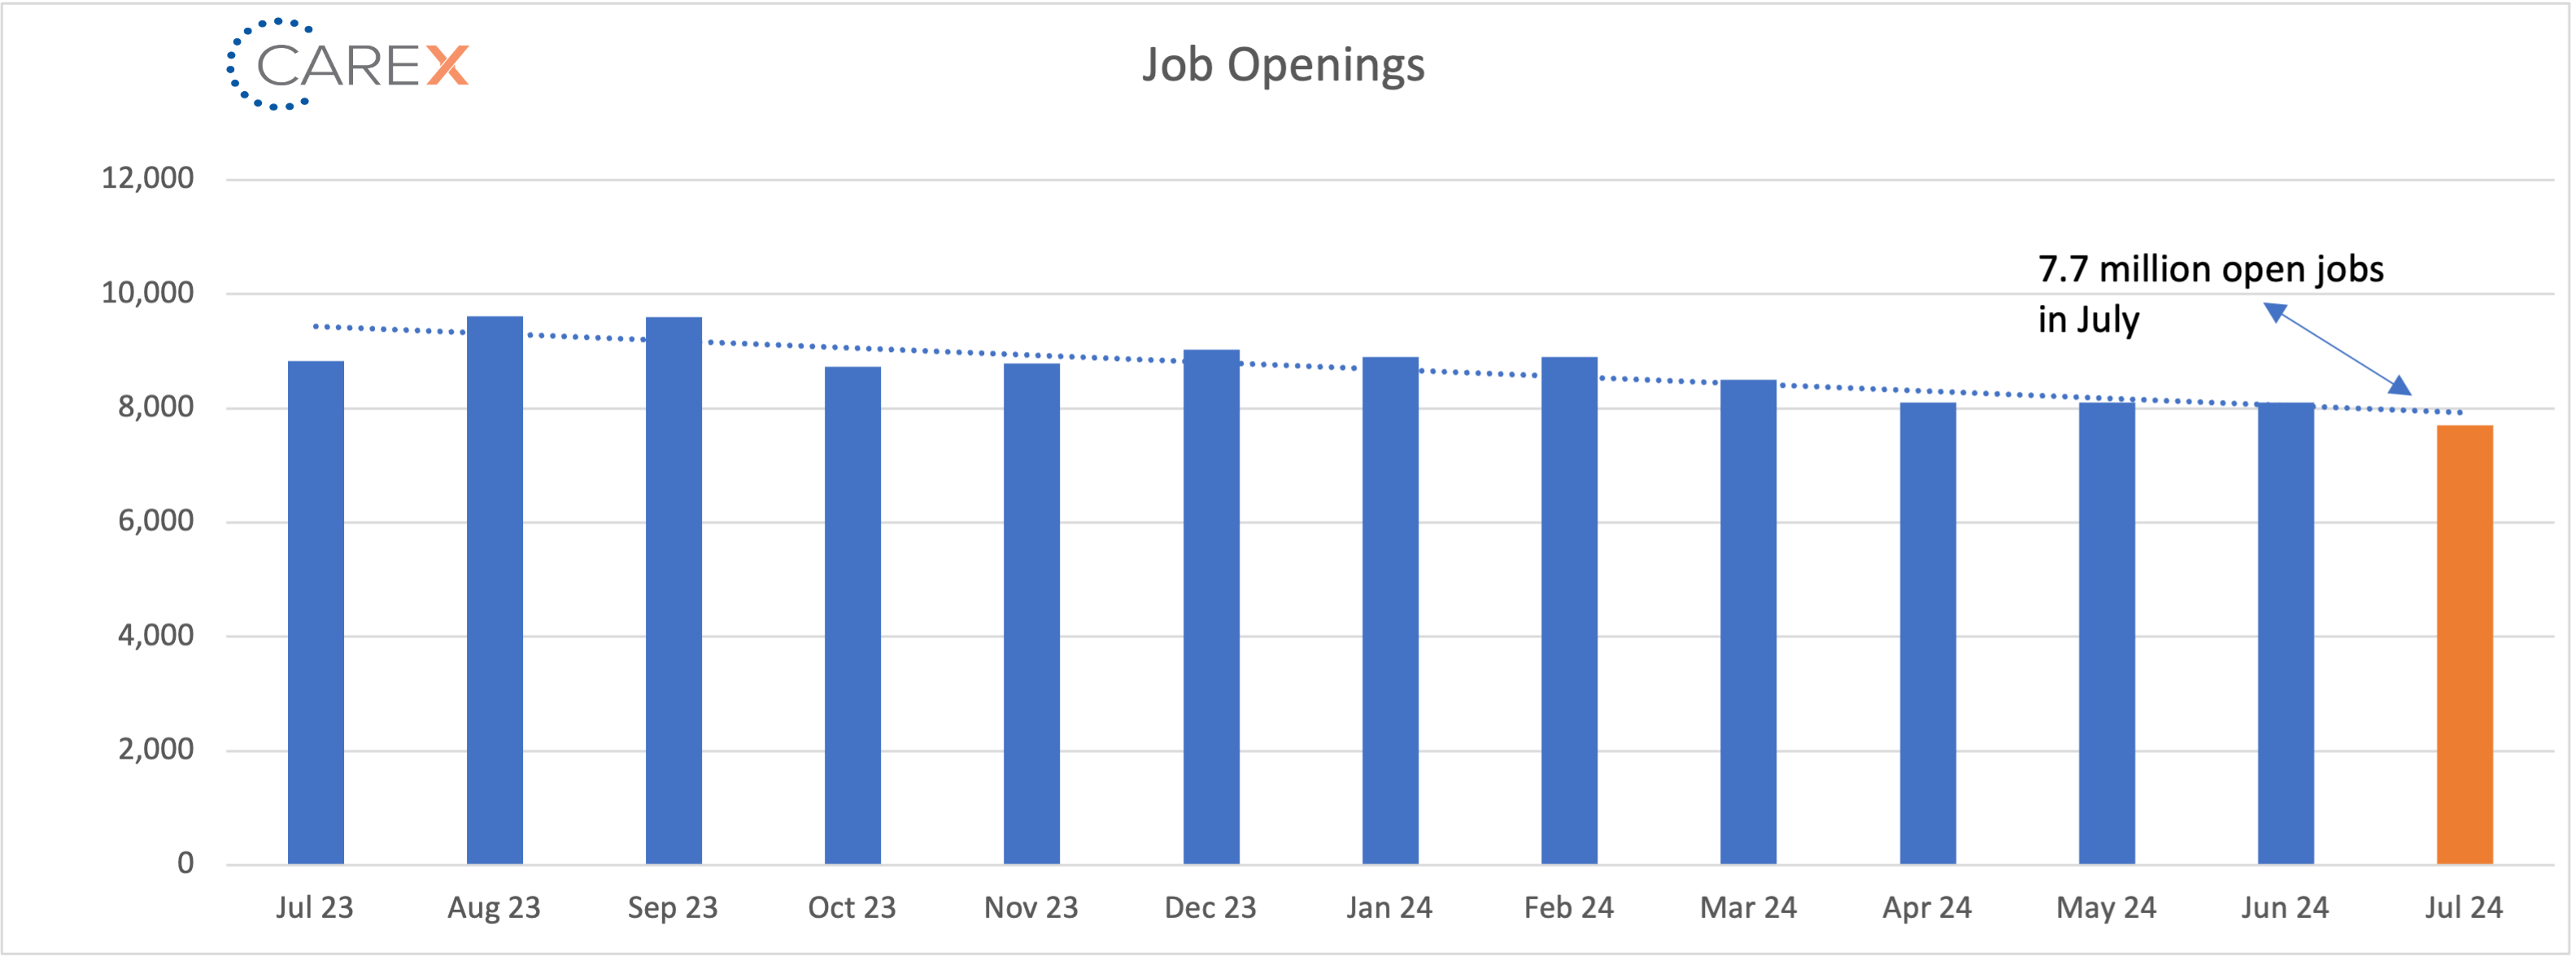
- The US has dropped to 7.7 million open jobs, the lowest level since January 2021
- The hiring rate is the lowest since mid-2014
- Jobs per-available-worker has dropped from 2:1 to just 1:1
- The job-finding rate is the lowest since 2016 (and it has been on the decline for 2+ years)
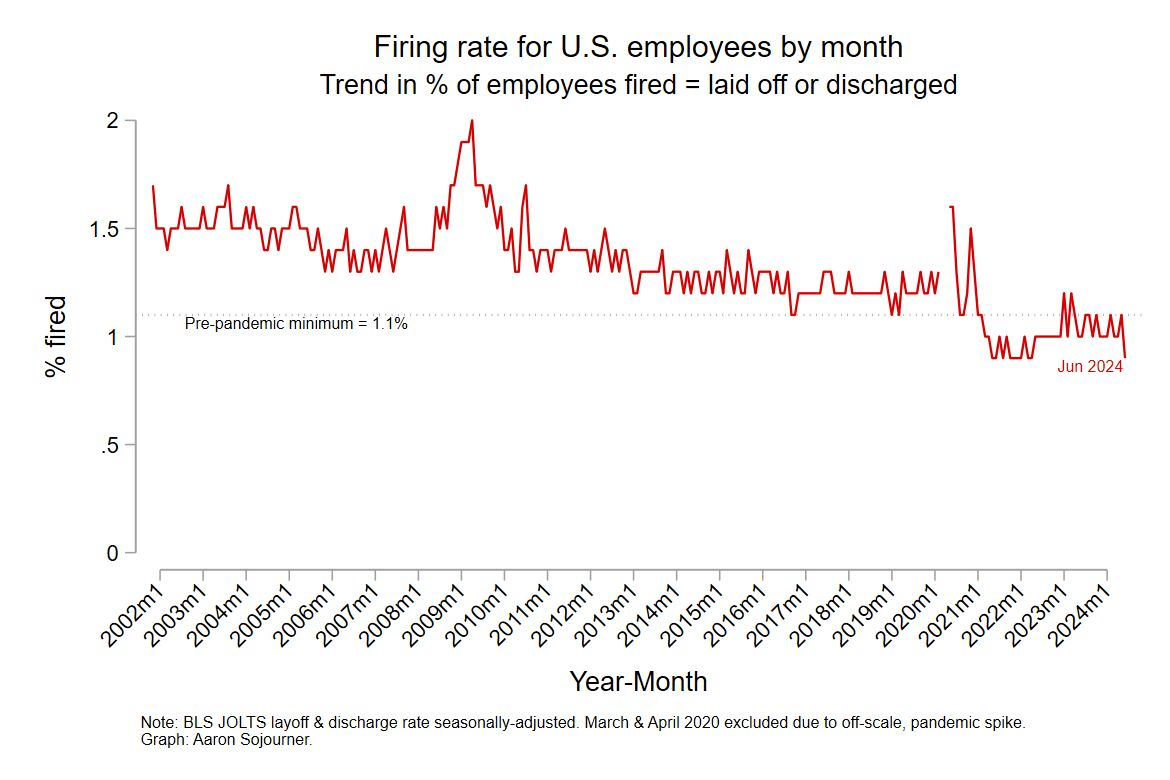
But it’s not all bad. The one silver lining is employee stability. By and large, companies (contrary to many headlines) are retaining their employees. In fact, companies are discharging employees at historic lows. Aaron Sojourner, with the W.E. Upjohn Institute for Employment Research, recently shared a graph that shows the trend line of laid off or discharged employees over the years (it’s still historically low).
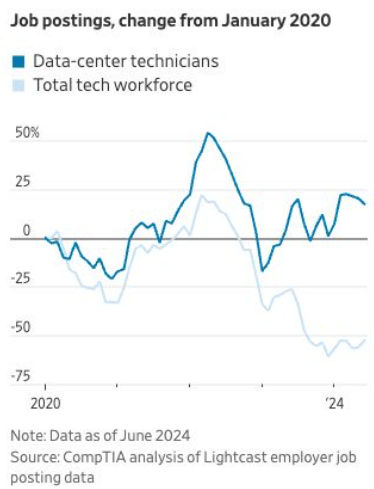
Even the tech sector (one of the hardest hit sectors over the past two years) has pockets of optimism. For instance, largely driven by AI innovations, Data-Center Technicians are in increasingly high demand (there are actually multiple examples of optimism in the Tech sector). While IT workers have been hit hard (see below), we’re actually starting to see employment stabilize, and are now seeing encouraging growth in certain areas.
Since the Pandemic, we’ve seen – (1) wide scale layoffs; (2) the great resignation; and starting late last year; (3) the great stay. It’s not just companies holding onto their people, employees are opting to stay put. I’ve heard more than a few leaders pat themselves on the back for their “solid retention numbers”. As I said – don’t get too overconfident. When the labor market improves, the pendulum might swing back to the great resignation trend we saw in 2022. Also, the quit numbers are exceedingly low – but that has much more to do with the market, than it does with any fancy retention strategies.
Below is a summary of the key labor market indicators:
By the Numbers:
- New Jobs – The U.S. added 142,000 new jobs last month
- Up from 89,000 (revised) from last month
- Notable sectors include Construction which led gains with 34,000 new jobs; and Health care adding 31,000 jobs
- Unemployment ticked down to 4.2%, down from 4.3% the previous month (but up from 4.1% two months ago)
- There are ~ 1.2 million more unemployed people today compared to this time last year
- Job openings dropped to 7.7 million, down slightly from 8.1 million the previous month
- The lowest rate since January 2021
- Three consecutive months of decline
- Professional and business services sector showed the biggest increase in openings with 178,000
- Private education and health services fell by 196,000
- Government, a leading source of job gains over the past few years, was off by 92,000
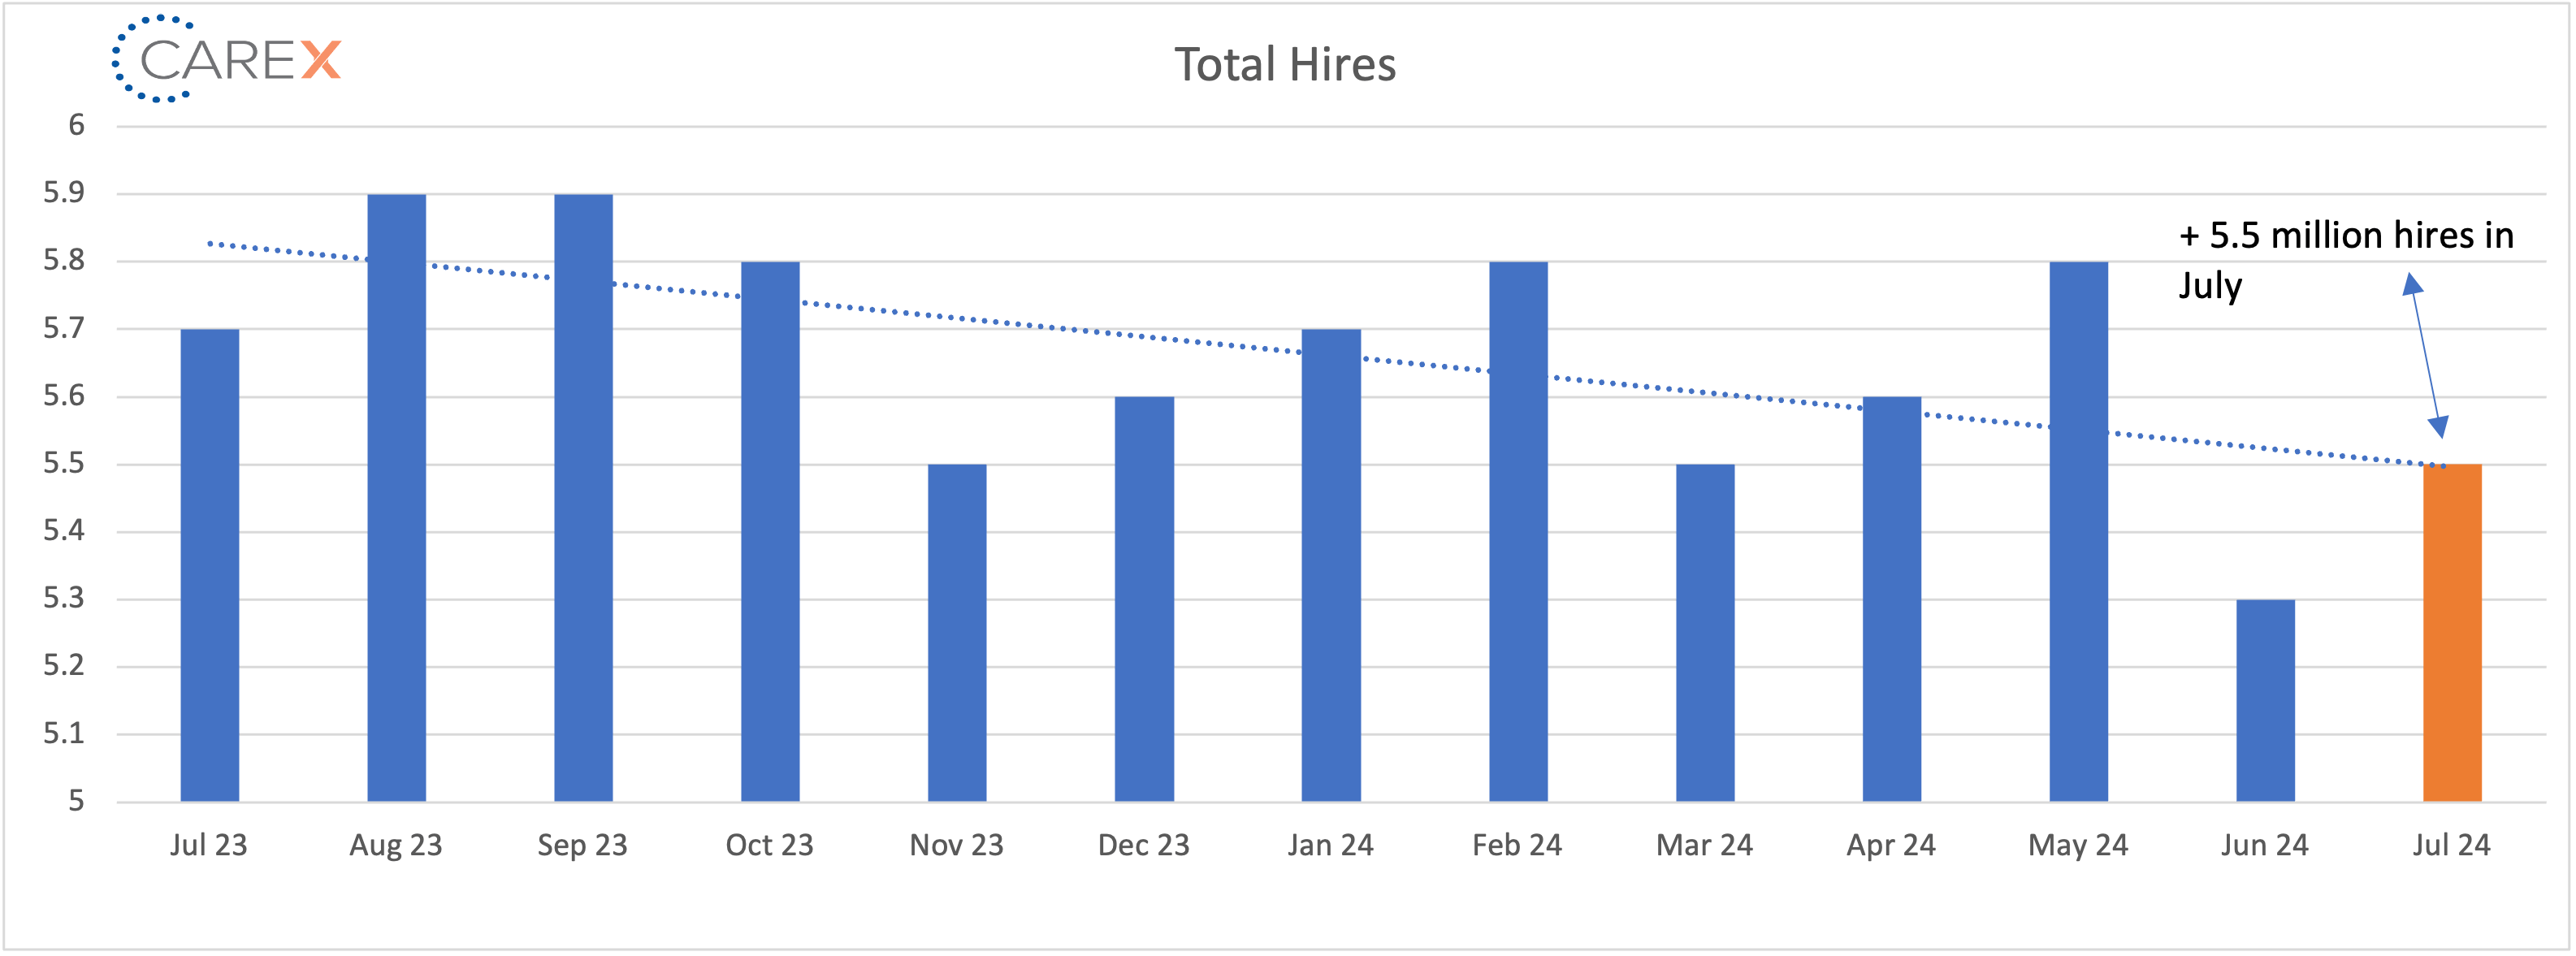
- Hires increased slightly to 5.5 million, up from 5.3 million the previous month (but down from 5.8 million three months ago)
- Down from 6.2 million this time last year
- Layoffs ticked up slightly to 1.8 million, up slightly from 1.7 million the previous month
- The layoff rate stayed at ~1% for the 11th consecutive month
- The number of layoffs remain very low by historical standards
- Quits remain unchanged at 3.3 million
- Quits, which are seen as a measure of worker confidence in the ability to change jobs and find another one continues to remain very steady – and very low
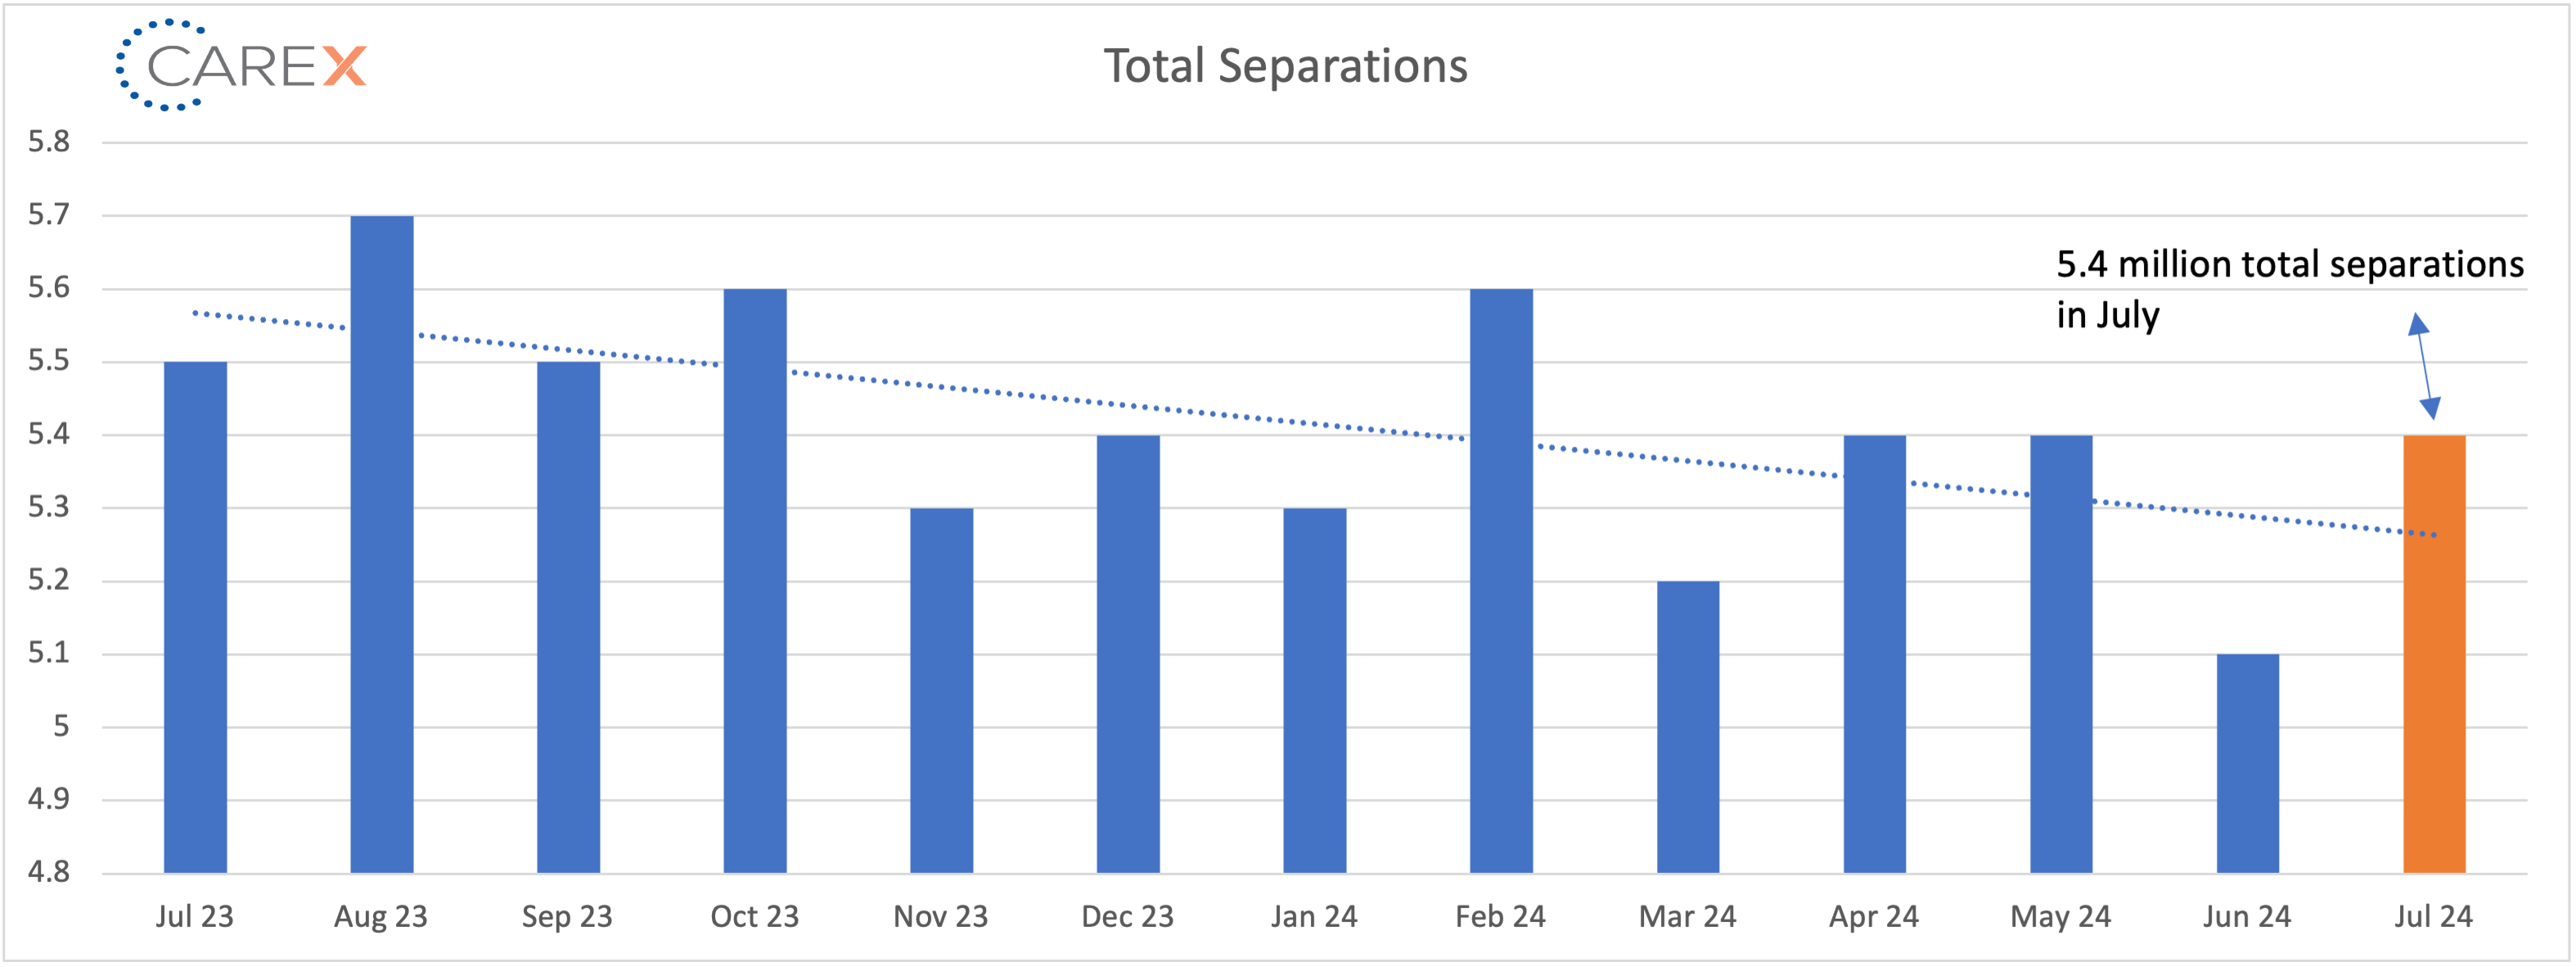
- Total separations increased to 5.4 million, up from 5.1 million the previous month
- Separations have stabilized across all industries, notably the tech sector
- Jobs per available worker held at 1.1:1
- Noticeably down from 1.8:1 last summer
- This ratio averaged ~2:1 over the past 2-years to just 1:1
- LFPR (labor force participation rate) remained unchanged at 62.7%
- It hit a high of 67.3% in early 2000 and fell to 63.3% in the month before the onset of the pandemic
To make sure you never miss a Labor Market Insights update, you can subscribe to receive reminders via email here! While you’re here, make sure to check out the other resources we have available.


